I have 2 histograms which I want to combine together to show a trend. They are 1D histograms and must be different colours.
How do I go about doing this please?
I have 2 histograms which I want to combine together to show a trend. They are 1D histograms and must be different colours.
How do I go about doing this please?
Thanks bro, 1 more question I have.
I have plotted some distributions that look Gaussian. How to I go about finding the average value and the spread of the function using root/C++ programming? I am using root to view the histograms and putty.exe. to write, compile and run my code.
Thanks in advance.
EDIT:
How do I call out/define the THStack? Because it is not like the other TH1D and TH2F histograms I have. How do I define it in my program?
root […] MyHisto->Fit(“gaus”);
See also http://root.cern.ch/download/doc/ROOTUsersGuideHTML/ch05.html and http://root.cern.ch/root/html/tutorials/
grep -r THStack ${ROOTSYS}/tutorials
Ok I am having some bad problems. I’m sure it’s due to my limited ability in programming but see:
THStack hs(“hs”,“Stacking”);
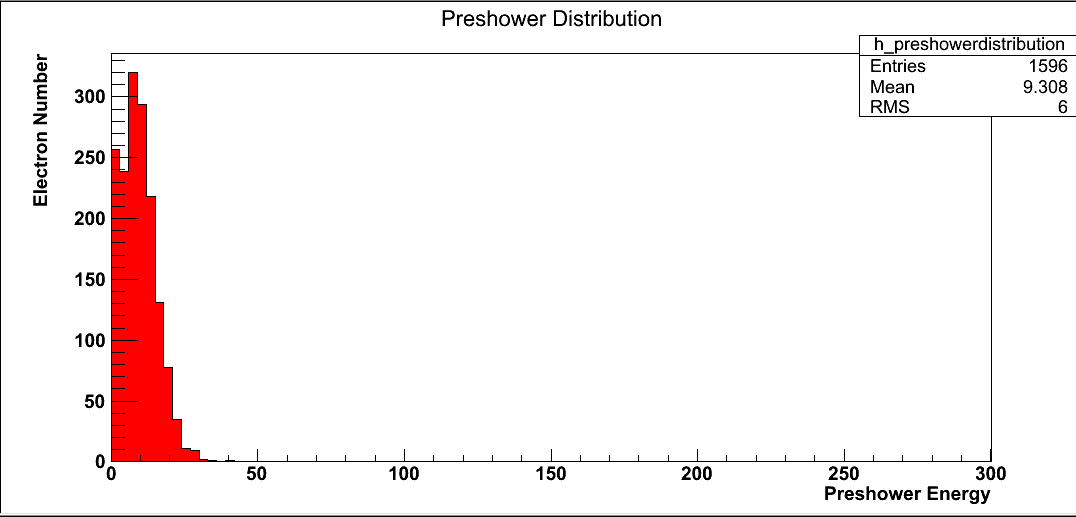
     h_preshowerdistribution->Fill(preshower);
     h_preshowerdistribution->Fill(preshower2);
     h_preshowerdistribution->SetFillColor(kRed);
     hs.Add(h_preshowerdistribution);

     h_electronenergy->Fill(endcapelectronenergy);
     h_electronenergy->Fill(barrelelectronenergy);
     h_electronenergy->SetFillColor(kGreen);
     hs.Add(h_electronenergy);
hs.Draw();
That is what I did and it tells me that ‘THStack’ was not declared in this scope…
maybe a missing #include “THStack.h”
It is always better to attach a complete (small) macro.
We can help you more efficiently.
I’ve managed to get the stack histogram to write, but due to the format of the histograms that I want to stack it comes out wrong.
For a 1D histogram, how do you determine what is plotted on the X or Y axis? For example in the attachment, I want to switch the X and Y axis around - I want Preshower Energy plotted on the Y axis. The stacking thing would work best if my energies are on the Y axis, then I can actually show the comparison and have a decent histogram.
I can only repeat what I already said: send a small macro.
Isn’t that what I just did? I thought macro meant picture attachment???
EDIT: If macro means code, then I will do that next time sorry. I resolved this issue.
I fit a gaussian fit over one of my distribution, how do I get the statistics out of it? Like Standard Deviation and the Mean? I can’t see any option in the link you gave me that allows me to switch on this option.
Also, how do I put non-integer values as my axis limits? I want to put 0.5 as my max but the compiler gives the ‘too many decimal points error’
Thanks for your help so far.
Yes a macro means code. It is much but for us to have piece of code to work with.
Thanks.
root […] MyHisto->Fit(“gaus”);
root […] TF1 *MyGaus = MyHisto->GetFunction(“gaus”);
root […] MyGaus->Print();
root […] MyGaus->GetParameter(0)
root […] MyGaus->GetParameter(1)
root […] MyGaus->GetParameter(2)
See also http://root.cern.ch/root/html/TF1.html and http://root.cern.ch/root/html/TFormula.html
Ok I have done it thanks very much.
I have forgotten about:
root […] MyGaus->GetChisquare()
root […] MyGaus->GetParError(0)
root […] MyGaus->GetParError(1)
root […] MyGaus->GetParError(2)
Note also that you can utilize different fit options: http://root.cern.ch/root/html532/TH1.html#TH1:Fit
For example, try something like:
root […] MyHisto->Fit(“gaus”, “L”);
I wish I was as smart as you guys…