Hi,
Anybody have a idea of how I can put a define color (for example green or the color of my preference) for a contour plot, I mean put color to h->Draw(“CONT1”), instead of the automatic color
Thanks
Nicolás
Hi,
Anybody have a idea of how I can put a define color (for example green or the color of my preference) for a contour plot, I mean put color to h->Draw(“CONT1”), instead of the automatic color
Thanks
Nicolás
Hi.
Sounds like you want to change the colormap. The default colourmap in ROOT is the rainbow colour
gStyle->SetPalette(1)I guess you can change to other palette by changing the above argument (from 1 to which ever number available). Now to define your own colormap, have a look at this website
rcnp.osaka-u.ac.jp/~noji/colormap
OR
rcnp.osaka-u.ac.jp/~noji/colormap
Thats a nice collection of palette s ! could you provide also the value you pass to TColor::CreateGradientColorTable for each of them ?
Note also the new palette 57 in ROOT: root.cern.ch/drupal/content/rai … or-map#r36
I mean, If I have:
See->Draw("CONT1");
Semu->Draw("CONT1 SAME");
How I can set different colors for each contour?
Ah, should have been much clearer with your question, and save time in getting answers 
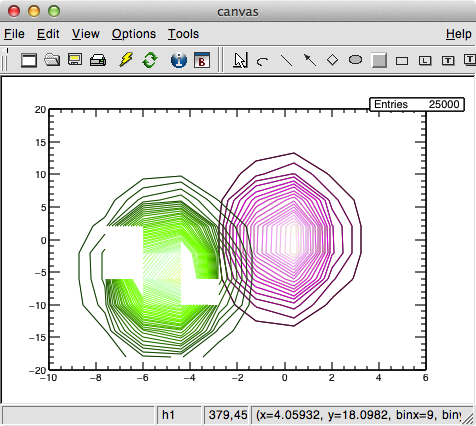
Have a look at code below for a “long and dirty way” to get what you want.
void plot_magenta();
void plot_green();

int test(){

  TCanvas *c  = new TCanvas("c","canvas",0,0,800,600);

  // Create two 2D histograms for testing
  TH2F *h1 = new TH2F("h1","",10,-10,6,10,-20,20);
  TH2F *h2 = new TH2F("h2","",10,-10,6,10,-20,20);
  Float_t px, py;
  for (Int_t i = 0; i < 25000; i++) {
    gRandom->Rannor(px,py);
    h2->Fill(px,5*py);
    h1->Fill(px-5,5*py-5);

  }

  // must have these lines - I don't know why
  TExec *ex1 = new TExec("ex1","plot_magenta();");
  TExec *ex2 = new TExec("ex2","plot_green();");

  // must draw it once here
  h2->Draw("cont1");

  // call first color then draw first contour plot again
  ex1->Draw();
  h2->Draw("cont1 same");

  // call second colormap then draw second contour plot on top of previous
  ex2->Draw();
  h1->Draw("cont1 same");

  return 1;
}

// define colormap for first contour plot
void plot_magenta() {
  const UInt_t Number = 4;
  Double_t Red[Number]    = {0.30, 1.00, 1.00, 1.00};
  Double_t Green[Number]  = {0.00, 0.00, 0.40, 0.90};
  Double_t Blue[Number]   = {0.10, 1.00, 1.00, 1.00};
  Double_t Length[Number] = {0.00, 0.30, 0.60, 1.00};
  const Int_t nb=50;
  TColor::CreateGradientColorTable(Number,Length,Red,Green,Blue,nb);
  gStyle->SetNumberContours(nb);
  return;
}

// define second colormap for the other contour plot
void plot_green() {
  const UInt_t Number = 4;
  Double_t Red[Number]    = {0.00, 0.40, 0.80, 0.90};
  Double_t Green[Number]  = {0.20, 1.00, 1.00, 1.00};
  Double_t Blue[Number]   = {0.00, 0.00, 0.80, 0.60};
  Double_t Length[Number] = {0.00, 0.40, 0.80, 1.00};
  const Int_t nb=50;
  TColor::CreateGradientColorTable(Number,Length,Red,Green,Blue,nb);
  gStyle->SetNumberContours(nb);
  return;
}
Ok, thanks a lot!!
Dear useROOT,
We like a lot the palette you display here: rcnp.osaka-u.ac.jp/~noji/colormap
It would be great to introduce them ROOT.
For each of them, Would it be possible to have the value you passed to TColor::CreateGradientColorTable ?
Thanks in advance,
Olivier