Dear Experts,
I am measuring the effective lifetime of Bs mesons with the help of Unbinned maximum likelihood fit in RooFit. The total likelihood model contains 4 components(Bs signal, Peaking, semileptonic and combinatorial backgrounds). To calculate effective lifetime, I use 2D UML fit between mass and decay time for each component. The decay time component is exponential with convoluted Gaussian resolution function for my signal. I am looking at the fitted Lifetime, fitted Lifetime error and the pull distribution for the lifetime. But for lower statistics(Bs Yield(30),peaking yield(6),semileptonic(50),combinatorial(120)) the pull distribution is an asymmetric distribution. The pull distribution of the lifetime is attached below.
I think this is due to low statistics and there must be a way around.
Could you please suggest me a way to overcome the asymmetry in the pull distribution?
Please let me know if you need anything more information.
Kind regards
Chandi
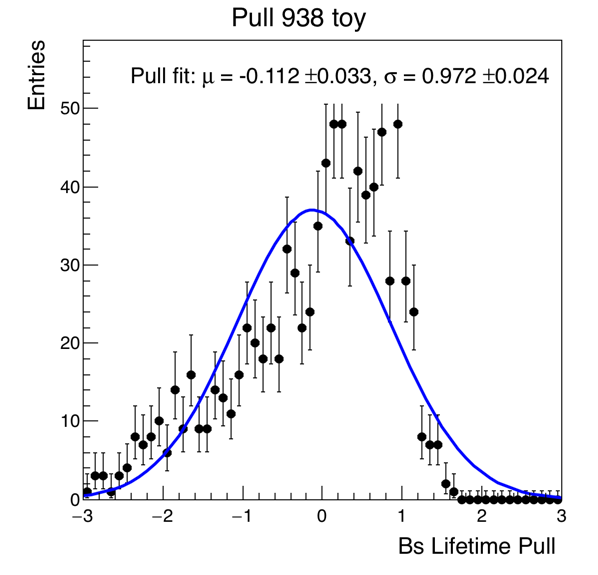
 You have about 10 bins voting “down” on the left-hand side, and 10 bins voting “up” on the right-hand side. Also the fall-off on the right-hand side is definitely not Gaussian; there is something else going on: it’s very likely a systematic effect.