Proof Lite memory consumption

Dear ROOT experts,
I am facing a problem related to the use of Proof Lite. Specifically, when I run my analysis code on a TChain made by thousands of files, using Proof Lite to process the TChain with a custom class inheriting from TSelector, I see that the memory consumption of the slave processes (proofserv.exe) increases while processing events, up to the point when all the memory available on my machine is used. To monitor memory use, I am using the “top” command, looking at the “RES” column. I can confirm that the memory is completely used also from the fact that, when this happens, the machine “freezes” and I have to kill the proovserv.exe processes.

I provide a tar file with all the files I am using in the analysis, to have a working example to reproduce this behavior. The example can be found here: http://www.ge.infn.it/~celentan/example.tar - it also contains one of the files I am using as input in the analysis. I think that, to reproduce the issue, one can just copy this file ~ 100/200 times and then run the analysis code on these equal copies.

The example can be compiled with Make (the first time this has to be executed twice), and launched with

./ana -f path_to_one_or_more_input_files -o name_of_the_output_file -nproof NumberOfWorkers

  • The input files contain different TTree objects, each TTree contains different branches, all branches are made by vector<double> or vector<int>.
  • The file ana.cc contains the main method of my analysis. I am first reading all the files to check their consistness (by looking at the last event in “header” TTree), then I create different TChain, and I use the AddFriend method to later access all the branches in the analysis.
  • I am creating a custom class anaSelector, inheriting from TSelector. The class is implemented in the two files anaSelector.cc and anaSelector.h. I am using SetBrancAddress in the Init() method and GetEntry in the Process method to read data from the different TFiles.
  • Note that in the Process() method, after the call to GetEntry I am immediately returning. This is telling me that the memory problem is related to the way data is read, and not to any subsequent operation I am doing on it.
  • In the ana.cc file I had to hard-code the location of the shared library containing the dictionary of the anaSelector class.
  • I tried to add a method clear_vector that deletes all the pointers to the vectors I am using, and resets these to zero, calling it in the Init() method, but this does not change the behavior of the code. Similarly, I added a call to this method in the Process() method, just before the return, but nothing changed.
  • To make sure the input files were not affected by the error described in this topic, before running the analysis code I re-created all of them using hadd.

Thanks,
Andrea

ROOT Version: 6.20.04
Platform: Linux CentOS7
Compiler: gcc 8.2.0

I give an update concerning this issue. I started proof with Valgrind on the workers, using the commands that were reported in this page: https://root.cern/running-proof-query-valgrind/ (btw, it looks that this link is broken, I used google cached version of the page).

TProof::AddEnvVar("PROOF_WRAPPERCMD", "valgrind_opts:--leak-check=full");
int nproof=8; //in my code, this actually comes from the command line
TProof *proof = TProof::Open(Form("workers=%i,", nproof),"valgrind=workers");

The valgrind log can be found here: http://www.ge.infn.it/~celentan/valgrind.log
The leak summary is:

==21720== LEAK SUMMARY:
==21720==    definitely lost: 18,037 bytes in 118 blocks
==21720==    indirectly lost: 26,139,608 bytes in 694 blocks
==21720==      possibly lost: 1,158,005,589 bytes in 96 blocks
==21720==    still reachable: 44,199,761 bytes in 59,920 blocks
==21720==                       of which reachable via heuristic:
==21720==                         stdstring          : 40 bytes in 1 blocks
==21720==                         newarray           : 45,992 bytes in 59 blocks
==21720==                         multipleinheritance: 8,304 bytes in 11 blocks
==21720==         suppressed: 894,953 bytes in 12,240 blocks
==21720== Reachable blocks (those to which a pointer was found) are not shown.

I am not an expert of this tool, but the following lines look suspicious to me:

==21720== 1,155,078,949 bytes in 33 blocks are possibly lost in loss record 11,964 of 11,964
==21720==    at 0x4C2A888: operator new[](unsigned long) (vg_replace_malloc.c:423)
==21720==    by 0x8A7A9D6: TFileCacheRead::SetEnablePrefetchingImpl(bool) (in /auto_data/fiber6/apps/jlab_software_20201020/2.3/Linux_CentOS7.6.1810-x86_64-gcc8.2.0/root/6.20.04/lib/libRIO.so)
==21720==    by 0x8A7AE70: TFileCacheRead::TFileCacheRead(TFile*, int, TObject*) (in /auto_data/fiber6/apps/jlab_software_20201020/2.3/Linux_CentOS7.6.1810-x86_64-gcc8.2.0/root/6.20.04/lib/libRIO.so)
==21720==    by 0x1B058547: TTreeCache::TTreeCache(TTree*, int) (in /auto_data/fiber6/apps/jlab_software_20201020/2.3/Linux_CentOS7.6.1810-x86_64-gcc8.2.0/root/6.20.04/lib/libTree.so)
==21720==    by 0x1B06E363: TTree::SetCacheSizeAux(bool, long long) (in /auto_data/fiber6/apps/jlab_software_20201020/2.3/Linux_CentOS7.6.1810-x86_64-gcc8.2.0/root/6.20.04/lib/libTree.so)
==21720==    by 0x1B06FAEB: TTree::LoadTree(long long) (in /auto_data/fiber6/apps/jlab_software_20201020/2.3/Linux_CentOS7.6.1810-x86_64-gcc8.2.0/root/6.20.04/lib/libTree.so)
==21720==    by 0x1B06FC17: TTree::LoadTree(long long) (in /auto_data/fiber6/apps/jlab_software_20201020/2.3/Linux_CentOS7.6.1810-x86_64-gcc8.2.0/root/6.20.04/lib/libTree.so)
==21720==    by 0x2221E867: TEventIterTree::PreProcessEvent(long long) (in /auto_data/fiber6/apps/jlab_software_20201020/2.3/Linux_CentOS7.6.1810-x86_64-gcc8.2.0/root/6.20.04/lib/libProofPlayer.so)
==21720==    by 0x2221E5E8: TEventIter::GetEntryNumber(long long) (in /auto_data/fiber6/apps/jlab_software_20201020/2.3/Linux_CentOS7.6.1810-x86_64-gcc8.2.0/root/6.20.04/lib/libProofPlayer.so)
==21720==    by 0x2225252D: TProofPlayer::Process(TDSet*, char const*, char const*, long long, long long) (in /auto_data/fiber6/apps/jlab_software_20201020/2.3/Linux_CentOS7.6.1810-x86_64-gcc8.2.0/root/6.20.04/lib/libProofPlayer.so)
==21720==    by 0x1ACEE4D8: TProofServ::HandleProcess(TMessage*, TString*) (in /auto_data/fiber6/apps/jlab_software_20201020/2.3/Linux_CentOS7.6.1810-x86_64-gcc8.2.0/root/6.20.04/lib/libProof.so)
==21720==    by 0x1ACEA3B1: TProofServ::HandleSocketInput(TMessage*, bool) (in /auto_data/fiber6/apps/jlab_software_20201020/2.3/Linux_CentOS7.6.1810-x86_64-gcc8.2.0/root/6.20.04/lib/libProof.so)

I tried to run my code without proof, and the memory consumption does not increase during the run.

I forgot to mention before that all the root files that I load in the TChain are on a remote disk, mounted locally via NFS.

I think @ganis, our Proof expert, can hope you.

When running “valgrind”, did you use the mandatory:

--suppressions=`root-config --etcdir`/valgrind-root.supp

Hi,
@Wile_E_Coyote : I did not run “valgrind” manually, I added only the string valgrind=workers and the call to TProof::AddEnvVar to the code and the run it with ./ana .... Then, I opened the valgrind logs in the appropriate sub-folder in the .proof folder in my home dir

EDIT
Looking at the slaves log in the .proof folder, it seems the command is executed as you suggest.

executing valgrind -v --suppressions=/auto_data/fiber6/apps/jlab_software_20201020/2.3/Linux_CentOS7.6.1810-x86_64-gcc8.2.0/root/6.20.04/etc/valgrind-root.supp --log-file=/home /celentan/.proof/auto_home-users-celentan-tmp/session-apcx4-1616075207-24511/worker-0.0.__valgrind__.log --leak-check=full /auto_data/fiber6/apps/jlab_software_20201020/2.3/Linux_CentOS7.6.1810-x86 _64-gcc8.2.0/root/6.20.04/bin/proofserv.exe proofslave lite 24511 0 0

Dear Andrea,
Apologises is this comes only now. PROOF is legacy for ROOT and my time in providing support is very little.
The problem seems related to the tree cache.
Can you try what happens if you turn it off?

root[] proof->SetParameter("PROOF_UseTreeCache", 0)

G Ganis

Dear Ganis,
thanks for your comment. I’ll try soon on the same machine where I saw this issue.

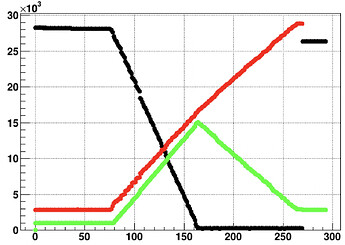
For the moment, I can comment considering a different machine, where more memory (32GB, 16 cores) is available. I wrote a very dummy code, that exploits the free command to quantify the memory that is used, cached, and free. I plot these versus time during the execution of my code.

I attach below the result, with and without the TTree cache, that I turned off via as you suggested:

TProof *proof = TProof::Open(Form("workers=%i,", nproof));
proof->SetParameter("PROOF_UseTreeCache",(Int_t)0); //THIS IS TO TURN OFF
proof->Exec("gSystem->Load(\"/home/celentan/tmp/libanaSelector.so\")");

With cache the result is the following. Black is “free memory”, red is “used memory”, green is “cached memory”. X axis is time (in s). You can see when the code starts to run (T~30 s) and when it ends (T~230 s). During execution, first both the used memory and the cached memory
increases, then when the free memory drops almost to zero, the cached memory decreases while the used memory continue to increase. Interesting, the total used memory used by the code (28G-3G = 25 G) is almost equal to the memory display in the Proof GUI, line “Processing Status”.

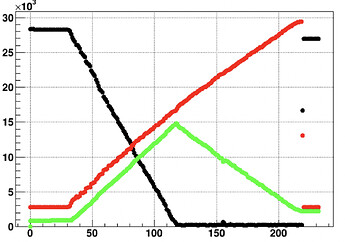
With the cache turned off, the result is almost the same (I double checked, recompiling the code from scratch just to make sure):

May I ask you if, from these graphs, you can conclude that possibly the command to turn off the cache did not apply?

Thanks,
Bests,
Andrea

Hi @andrea.celentano ,
while we wait for @ganis , let me point out RDataFrame as a modern replacement for PROOFLite. It supports execution of arbitrary C++ code during the event loop but also offers facilities for many common use cases. It supports multi-thread event loops out of the box and scales to thousands of histograms and large datasets (see e.g. this talk for some performance measurements by a RDataFrame user). The downside of course is that migration requires rewriting possibly large parts of the analysis scaffolding (actual analysis logic typically can stay the same or almost the same), but if you ever get around to it I’d be glad to take a look at any remaining memory usage issues.

Cheers,
Enrico

Hi @eguiraud,
thanks for your comment! I think I’ll definitively move to RDataFrame for any new code that I’ll develop, requiring more than a simple TTree::Draw() call! However, for this specific code, that was written year ago, I’d prefer to keep it as it is, and possibly solve the memory issue - in the past, this was not observed because we run it on smaller datasets.
Thanks again!
Cheers,
Andrea

Of course, that’s totally understandable. I think something that would help moving this forward would be:

  1. re-running valgrind using a build with debug symbols, so that the valgrind log points to the exact lines responsible for the reported leaks
  2. running valgrind --tool=massif, which reports precisely which lines allocate how much memory over the course of execution of the program

However do note that, as previously mentioned, PROOFLite is considered legacy code and personpower dedicated to its support is limited.

Cheers,
Enrico

This topic was automatically closed 14 days after the last reply. New replies are no longer allowed.