I’m trying to project multidimensional RooHistPdf while integrating over a specific range of other variable: exactly what is shown at RooFit tutorial macro #310 but with RooHistPdf as a model.
Unfortunately, the model doesn’t catch normalization properly.
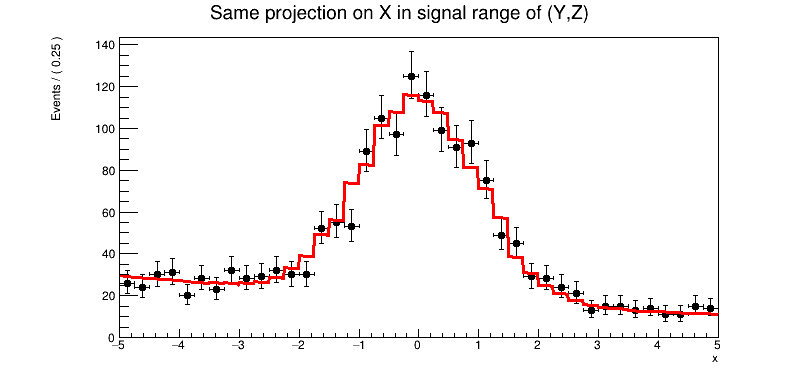
See the minimal working example (code and problematic output) attached.
Could you please help me to get normalization properly?
(I’m using RooFit v3.60)
We need our RooFit expert @StephanH to be back to answer your question. He should return from travel next week; please ping here should you not get an answer by end of next week!
Hi @StephanH, sorry for bothering you, but @Axel suggested to ping you to point at this question.
Do you have may be any ideas how to fix RooFit behaviour here?
it looks like there is a bug in computing the relevant integrals, but there’s apparently a way around it:
Create a dataset that only contains events in the signal range (that happens anyway for plotting, so you can create it once, and also use it for plotting).
Ask for a data-weighted projection, i.e. project out the curve only at the locations indicated by the data points in the sample.
auto projData = static_cast<RooDataSet*>(mcprojData->reduce(Cut("<signalRegionCuts>"))); //Probably CutRange(const char* name) also works
model.plotOn(frame2, ProjWData(*projData));
Thanks, @StephanH!
This solution works for the example, but there are some problems when I try to use it in “real” code
(I have big 7D sample and ProjWData doesn’t seem to scale there). But this is another business - let me investigate my own issues in detail and open another topic if needed.