ProjectionX intercept line

Hi,

I would like to draw lines to this curve that show 90%, 50% etc as on the picture. I drew these “manually”.

I get the y coordinate by

projX.GetMaximum()*.9

How could I get the x coordinate?

This way:

maxiX=projX.GetMaximum()
lineX_90=ROOT.TLine(-8.5,0, -8.5, maxiX*.9)
lineX_90.Draw("same")
lineX_90p=ROOT.TLine(7.5,0,  7.5, maxiX*.9)
lineX_90p.Draw("same")
lineX_50=ROOT.TLine(-17,0, -17, maxiX*.5)
lineX_50.Draw("same")
lineX_50p=ROOT.TLine(17,0,  17, maxiX*.5)
lineX_50p.Draw("same")


Note that you do not need the option same to draw the lines.
it seems you were able to find x coordinate on your plot ?

Hi,

Thanks!

Yes, I found it by placing the line on the canvas and adjust it manually I would need to make it automatic.

If i could access the coordinates of the projection I would just need to find the closest y to my y.

How could I do this?

I am not sure what are the “coordinates of the projection” in your mind… May be you should just use GetXaxis() on the histogram and use the getter(s) you need, there is many. See the TAxis doc.

Thank you!

I’m probably blind because looked through the gets and can’t see how to get the x coordinate for a y coordinate on the curve. I think my solution is too complicated to do this look through all the bins and see which one is closest.

Something like:

for i in range(0,projX.GetNbinsX()/2):
...     try:
...         npt.assert_almost_equal(projX.GetBinContent(i), yCoordinate, decimal=0)

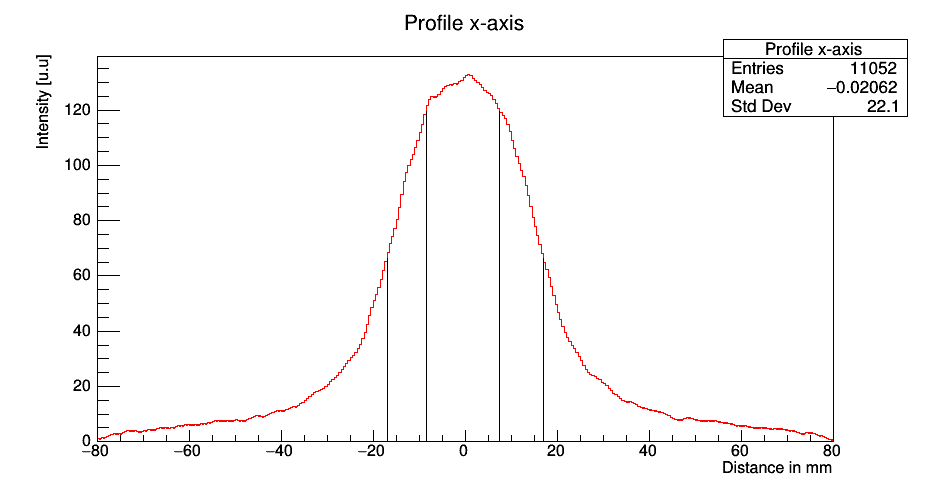
So I get the y coordinate and just want to get the coordinate so I can draw a line from the x axis to the curve.

Ah ok, I understand now. The best is to write a function looping on all the bins and for each bin corresponding to the value you want, you draw the line.