ProjectionX does not work properly

Dear experts,
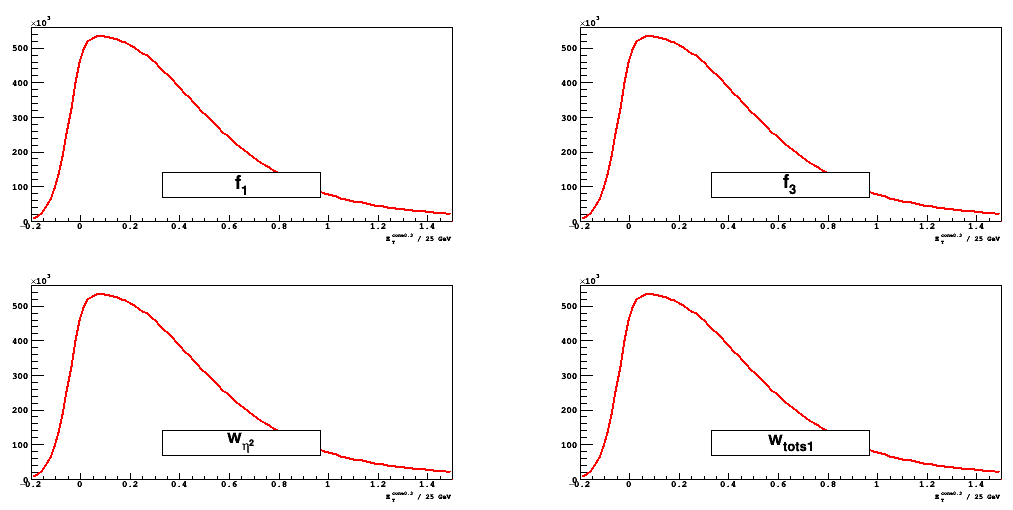
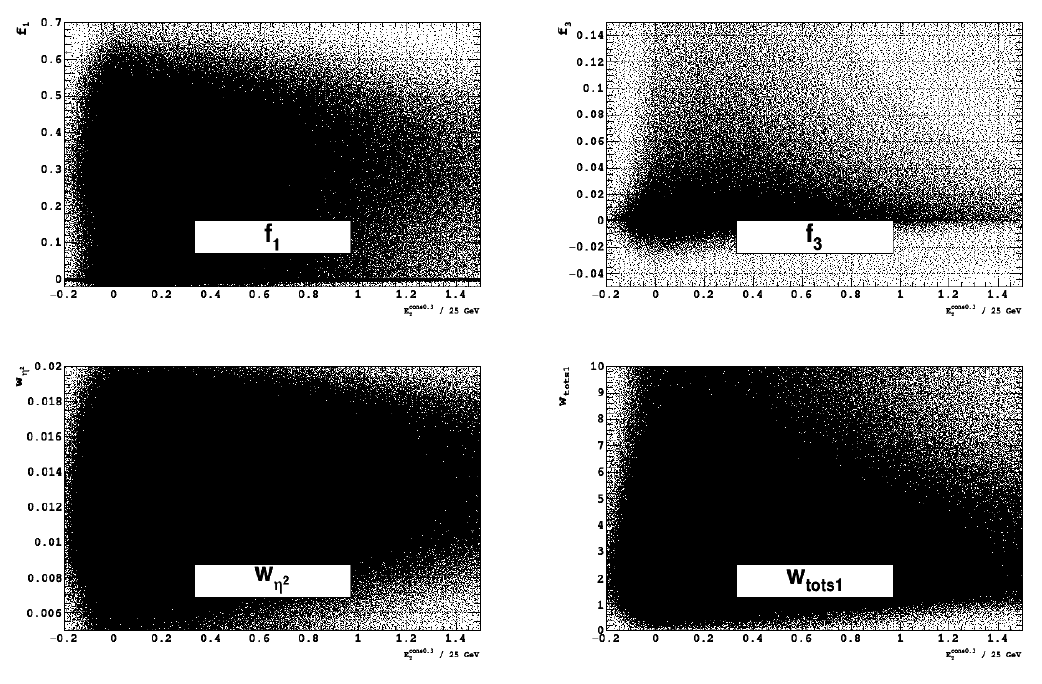
I made a TH1D array to collect ProjectionX from a TH2D array, but all the hist (the ProjectionX) are the same as you can see here (1) and that is not expected. Indeed the corresponding 2D hist looks like this (2). All the codes are here (3), do you see what is wrong?
Regards

(1)

(2)


(3)
http://calpas.web.cern.ch/calpas/correlation.cc
http://calpas.web.cern.ch/calpas/rootstyle.cc
http://calpas.web.cern.ch/calpas/hist.root

Your file correlation.cc has a syntax error. a “;” missing on the TFile line.
I fixed that but then, when I execute your macro, I get two empty canvases.

Dear Couet,
I just run in root 6.12 and I have 7 canvas created. Only the 1 one (canvas[0]) is fill.
Regards

I do :

$ root correlation.cc 
   --------------------------------------------------------------------
  | Welcome to ROOT 6.15/01                        http://root.cern.ch |
  |                                       (c) 1995-2018, The ROOT Team |
  | Built for macosx64                                                 |
  | From heads/master@v6-13-04-1003-g40f3fa9467, Aug 23 2018, 15:32:14 |
  | Try '.help', '.demo', '.license', '.credits', '.quit'/'.q'         |
   --------------------------------------------------------------------

root [0] 
Processing correlation.cc...
name: f_{1}
max: 533881
pad_max: 1
scale: 1.87308e-06
name: f_{3}
max: 533881
pad_max: 1
scale: 1.87308e-06
name: w_{#eta^{2}}
max: 533881
pad_max: 1
scale: 1.87308e-06
name: w_{tots1}
max: 533881
pad_max: 1
scale: 1.87308e-06
name: R_{eta}
max: 533881
pad_max: 1
scale: 1.87308e-06
name: R_{had}
max: 533881
pad_max: 1
scale: 1.87308e-06
root [1] 

two canvas are open. They have subheads… all empty

I just change the code a bit to make only 1 canvas. It is working? I have the sample print on the screen then you, but I also have the hist.
Regards

now I get one canvas:

Dear Couet,
do you understand why all the hist are identical?
Regards

If I do not use the full range I get different histograms:

    h_projx[var] = h_corr[var] -> ProjectionX(v_name_hist[var].c_str(), 1, 50, "eo");

Could it be that despite the fact the 2D histograms are different their projections on the Y axis are the same ?

If I do the projection along Y then I get different histograms.

    h_projx[var] = h_corr[var] -> ProjectionY(v_name_hist[var].c_str(), 0, -1, "eo");

So it really seems that, along X, all these histograms give the same projection. Can that be explained theoretically ?
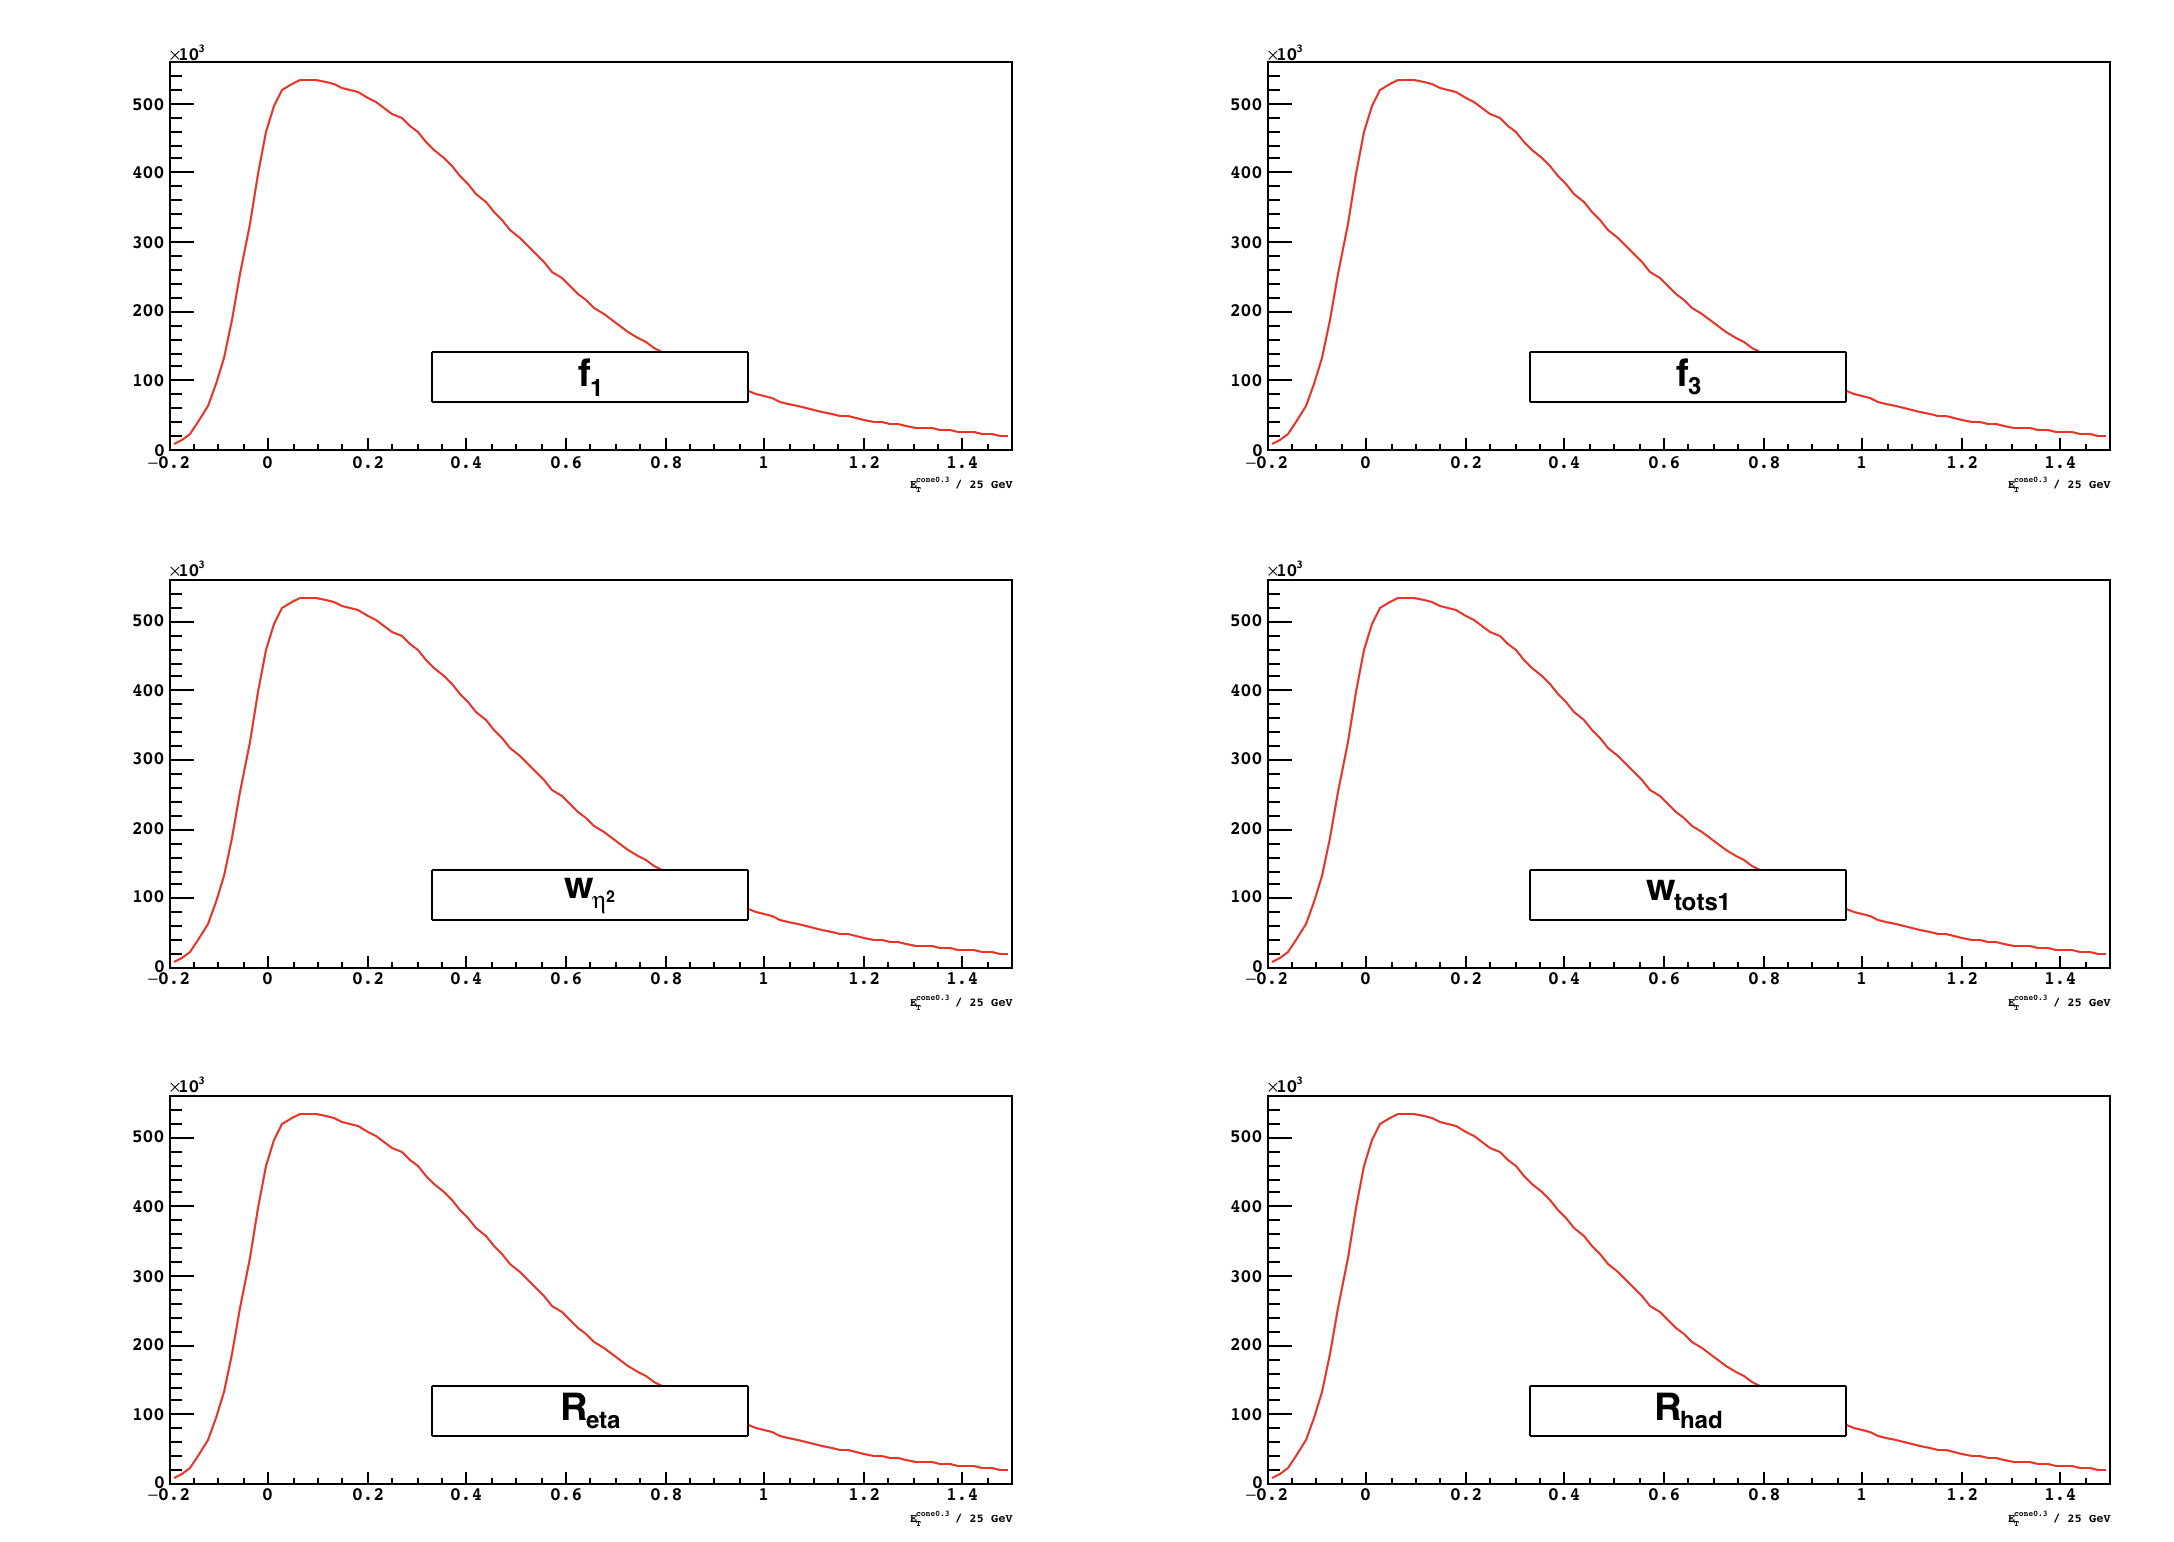
I also to rein interactively your histograms (plotted as LEGO) and it seems to confirm the projection are identical (I squeezed the histo to 2 bins only, the minimum we can do)

Dear Couet,

  • I do not see now, I’ll investigate.
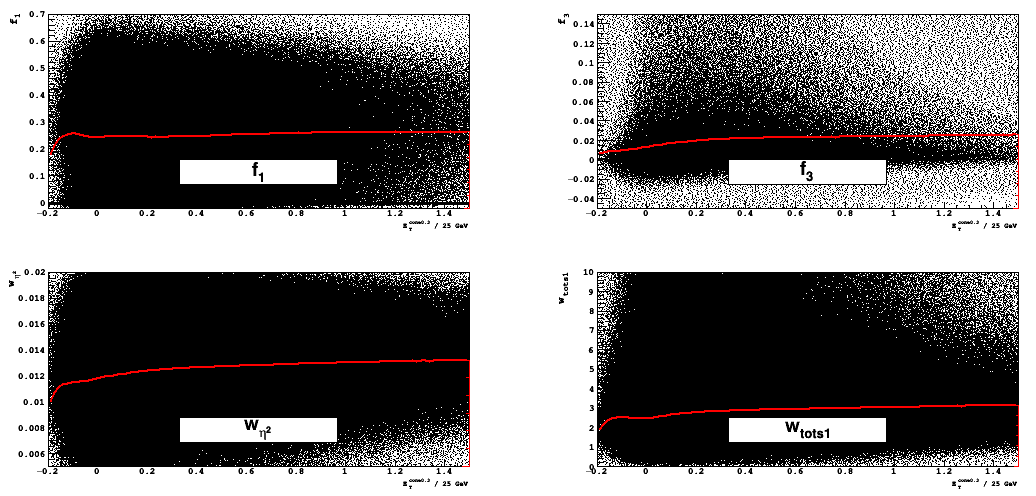
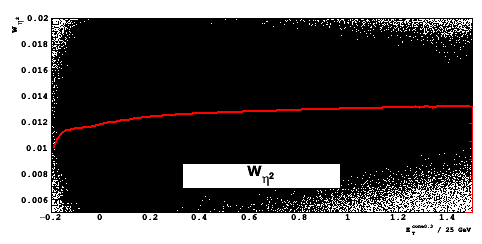
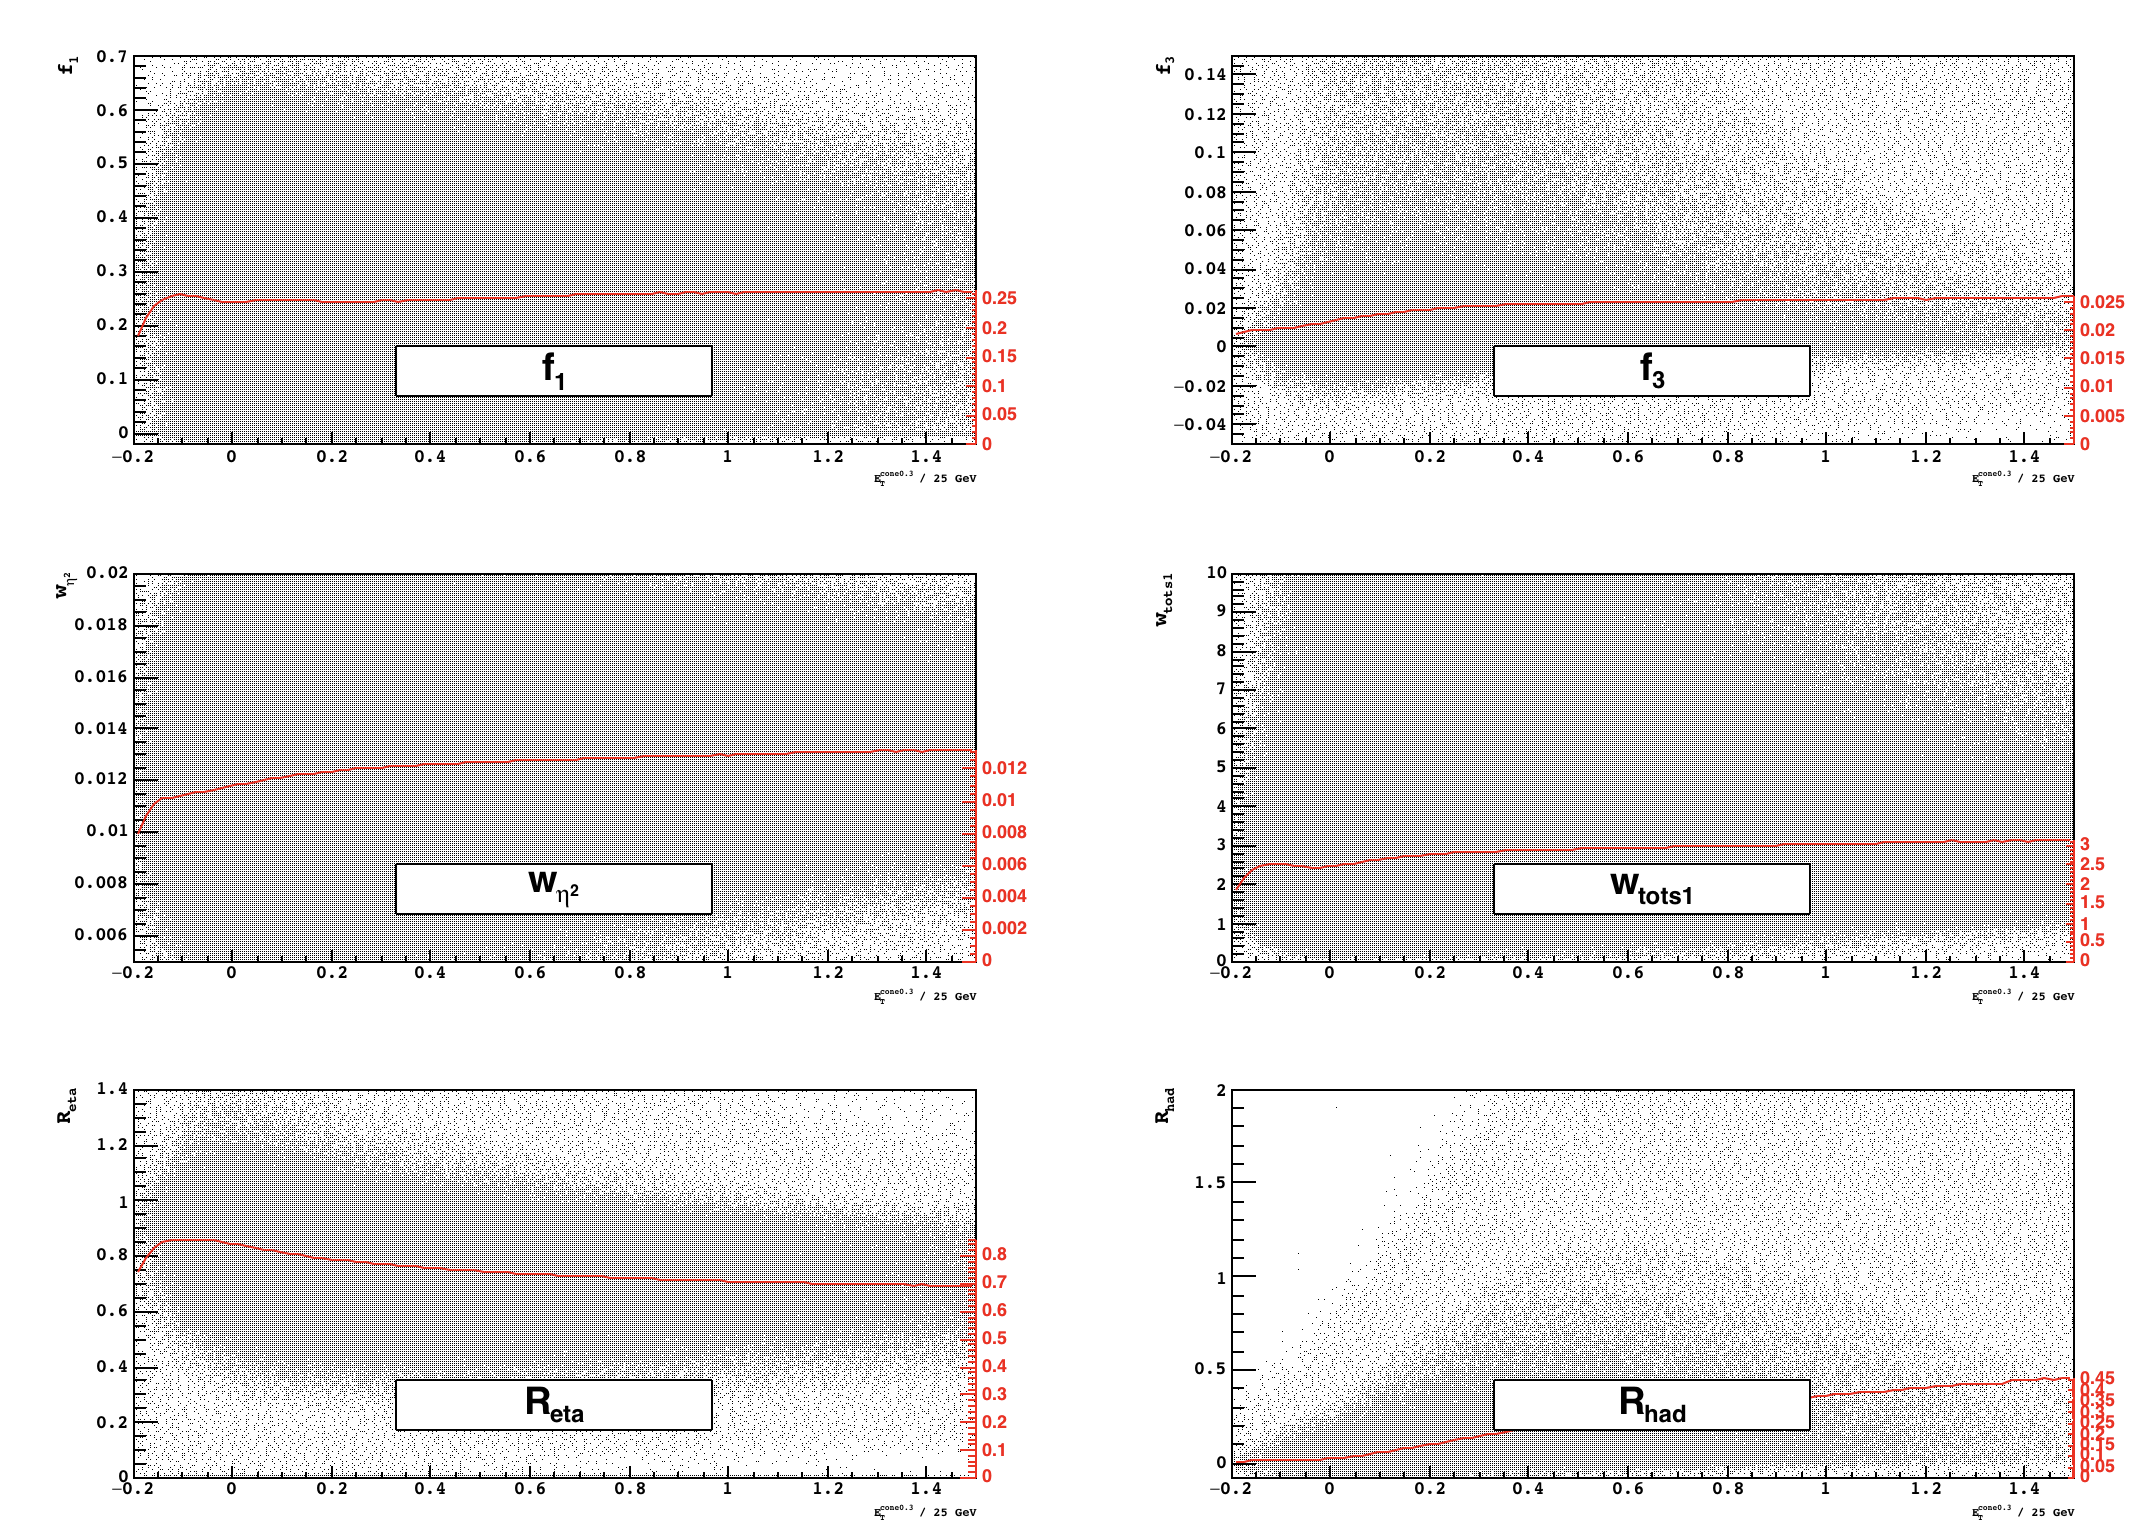
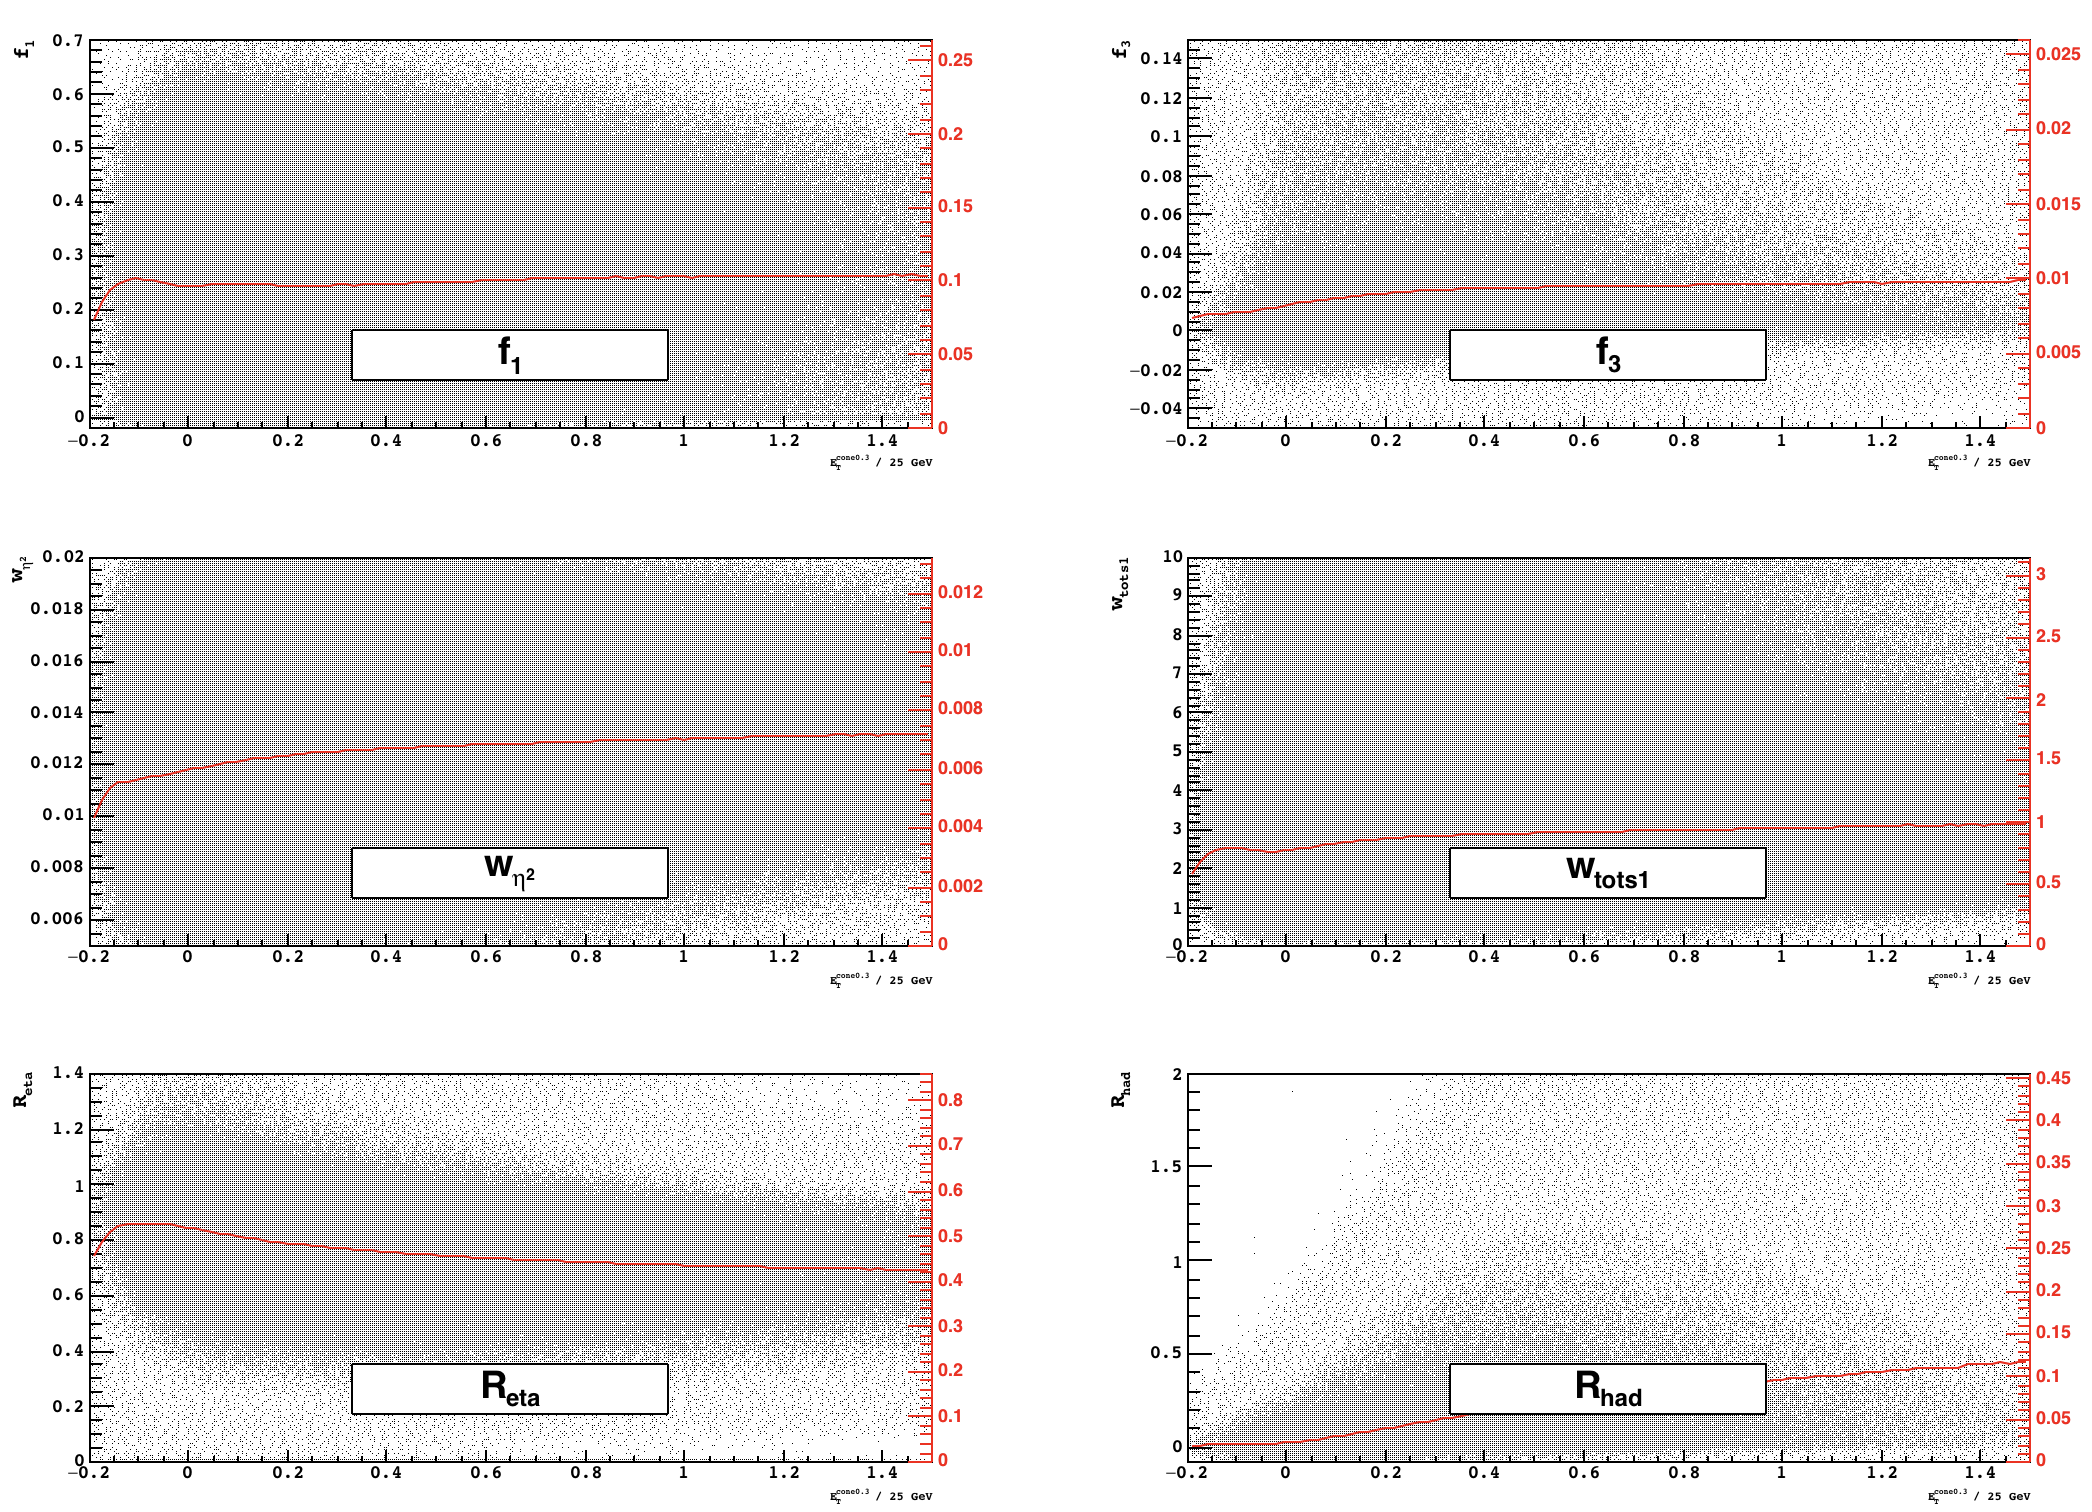
  • Here I used the ProfileX (1), and I have this plots (2). The ProfileX is in red on top of the 2D hist. My concern is the right red axis, it does not display the axis value. Do you see why?
    Regards

(1)
http://calpas.web.cern.ch/calpas/correlation.cc

(2)

Yes.
You asked 0 primary divisions and the labels are on the primary divisions.
Try:

      TGaxis *axis = new TGaxis(xaxis_max, yaxis_min, xaxis_max, rightmax, 0, rightmax, 510, "+L");
      axis->SetLineColor(kRed);
      axis->SetLabelColor(kRed);
      axis->Draw();

Dear Couet,
I still do not see the number on the right axis with what you proposed (1).
Regards

(1)
image

This macro correlation.cc (3.3 KB)

give me:

Dear Couet,

  • thank you. I still wonder how can I properly spread the right axis to the entire pad? For ex. on the last plot, we can not read the number but we still have plenty of space, to we could spread it. Is there some normalization to do?
    Regards
      double yaxis_max =  h_projy[var] -> GetXaxis() -> GetXmax();

[...]

      TGaxis *axis = new TGaxis(xaxis_max, yaxis_min, xaxis_max, yaxis_max, 0, rightmax, 510, "+L");

This topic was automatically closed 14 days after the last reply. New replies are no longer allowed.