hi, everyone,
I run into a problem when using RooPlot.
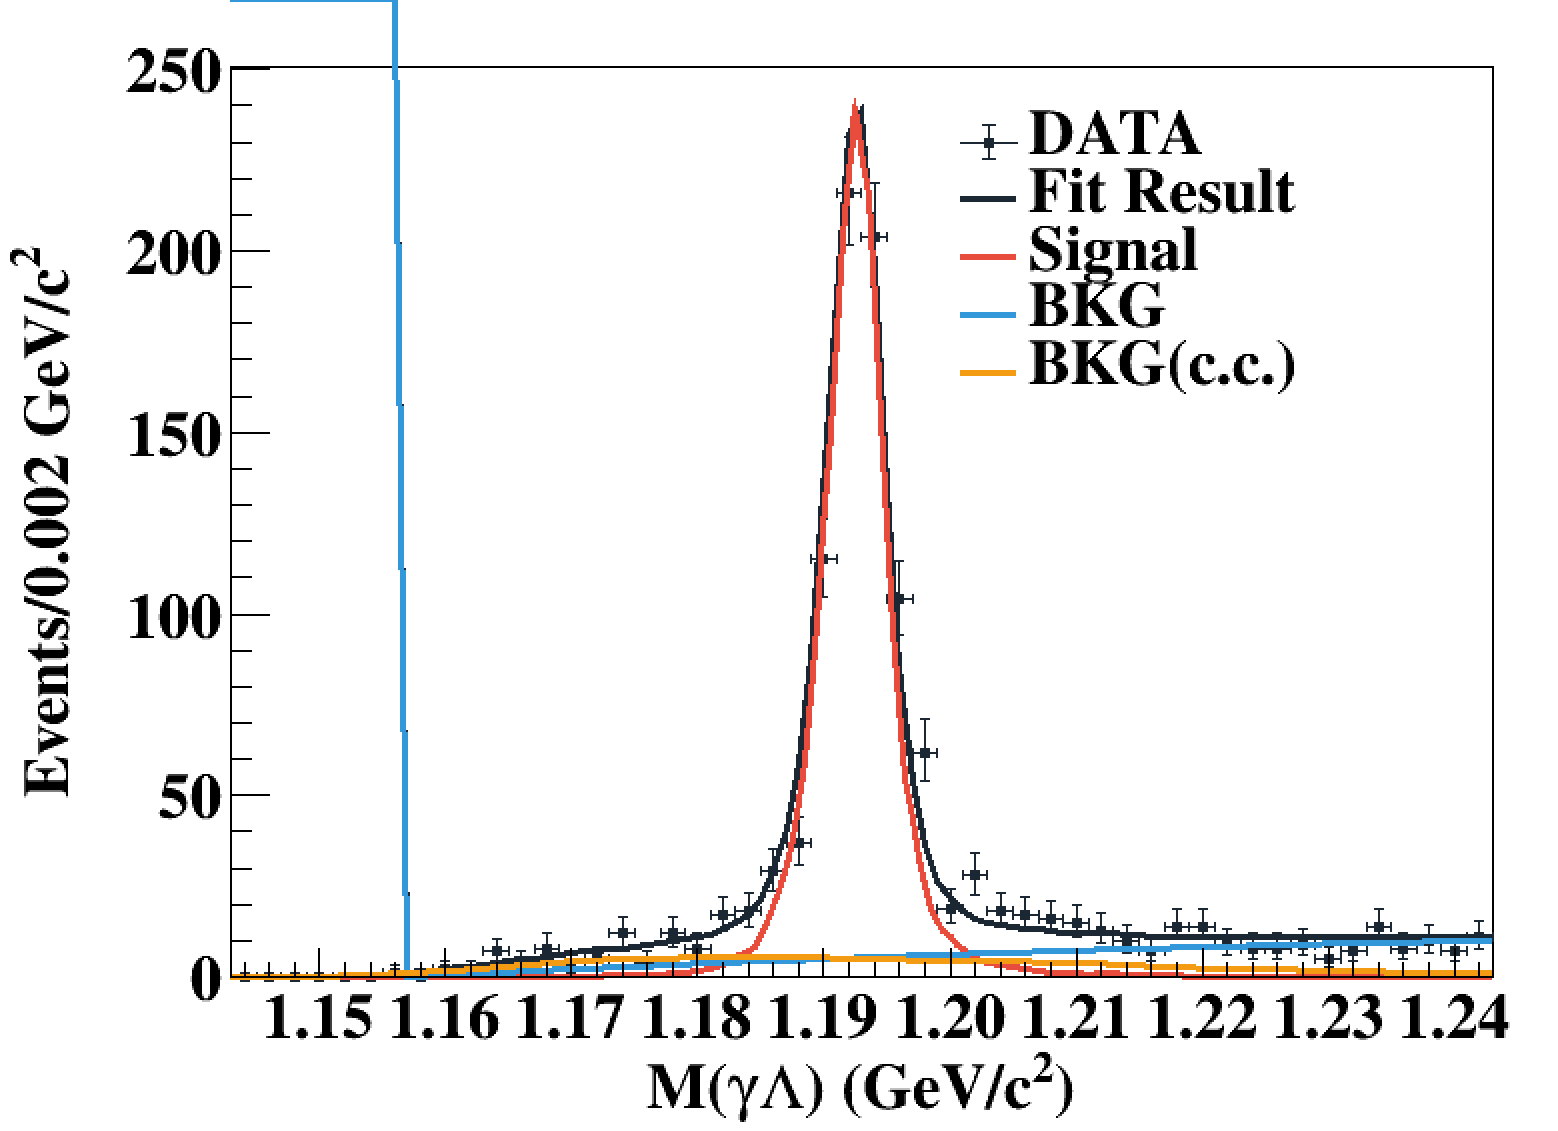
There is a vertaical line at the right of the figure, and the blue line represnets a first order chebyshev function.
The problem did not happened in the past. And The script has not been changed all the time.
my ROOT version is v6.24/06, and roofit is v3.60.
Thanks for any help.