Problems with plotting and saving TGraph with negative values in log scale

Dear experts,

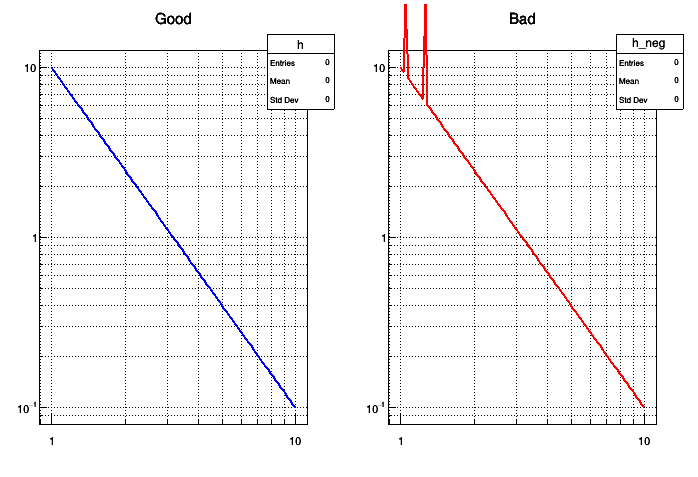
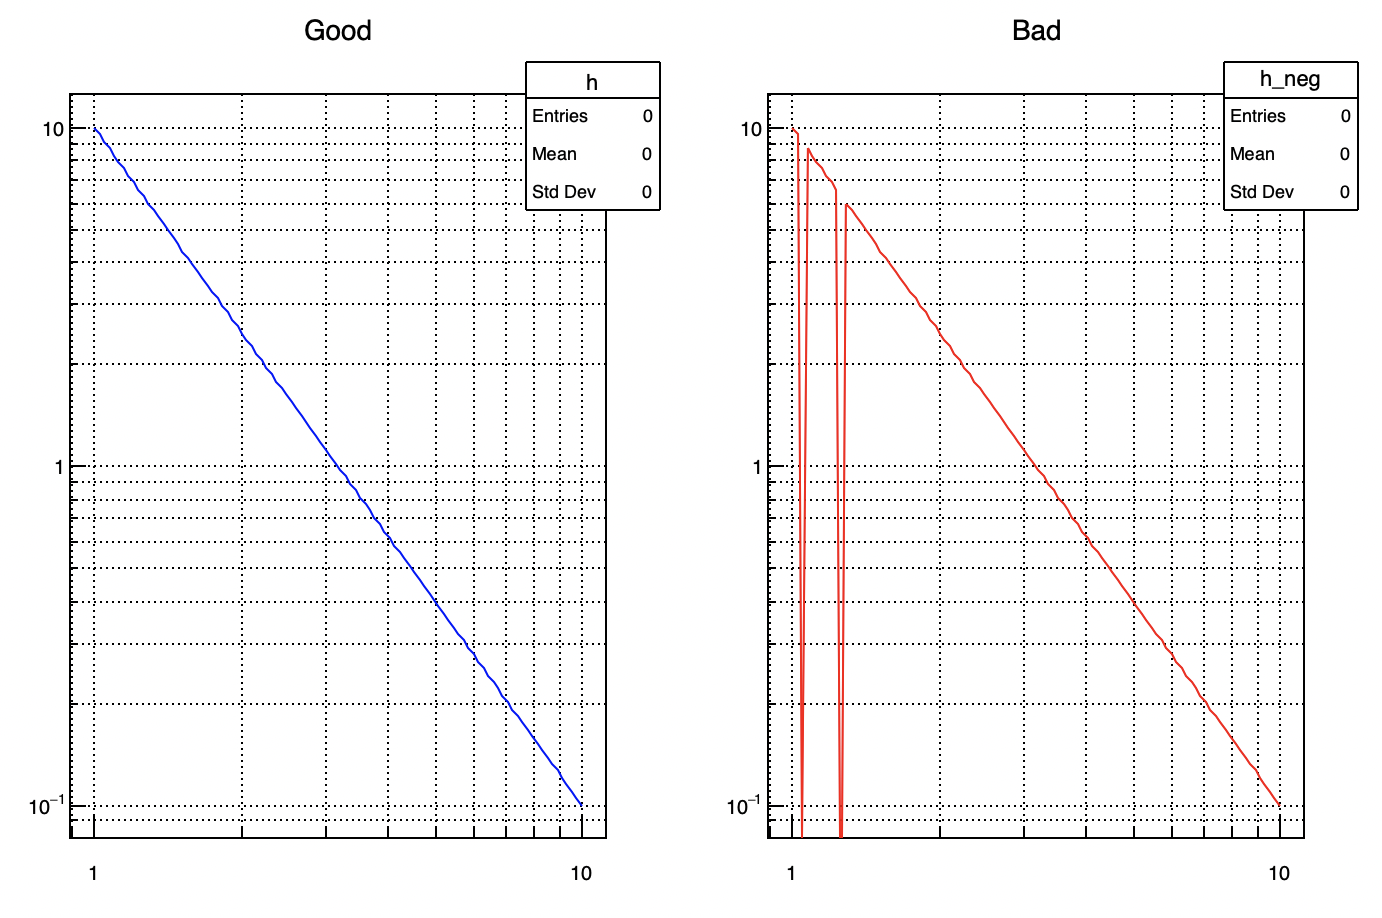
I’m plotting the results of a numerical model, which sometimes fails and return very large negative and positive numbers.
I create an axis with an empty TH1 so I can set the axes limits, set both axes to log scale, then plots a bunch of TGraphs with “L SAME”.
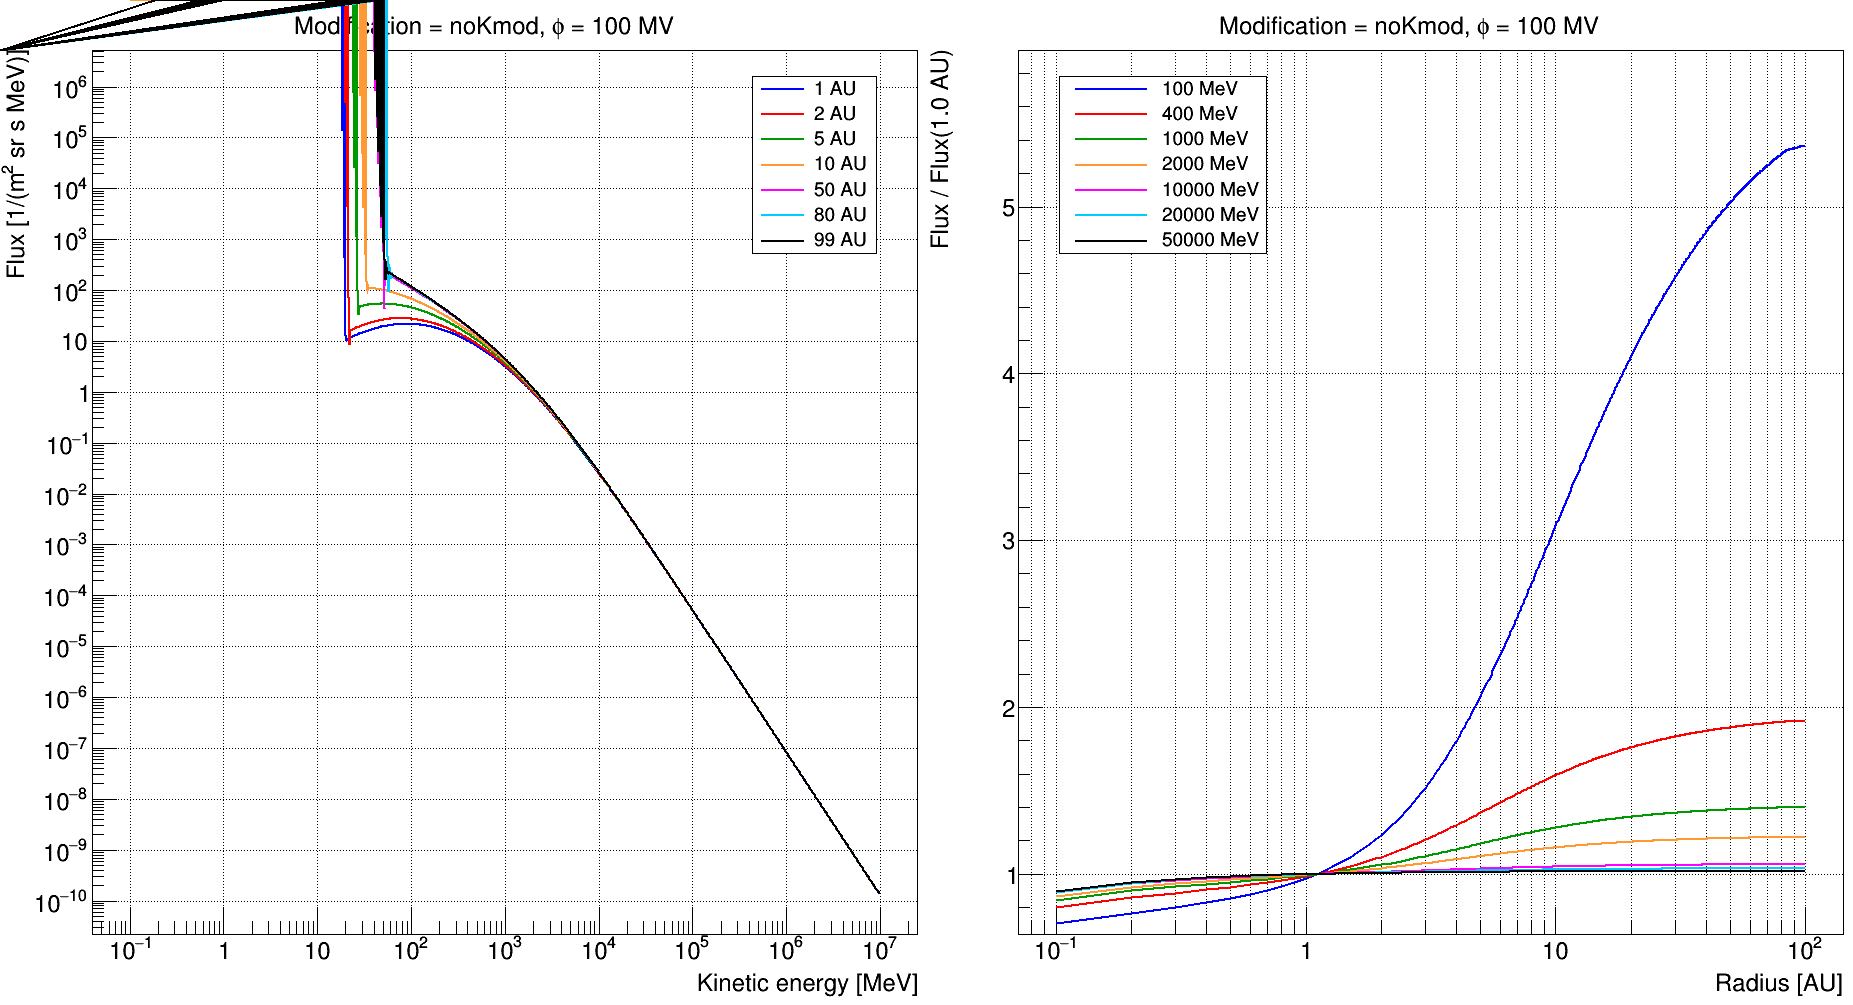
The plots are ok (see attached png), except for weird behavior in the range where the model results are unstable (below 100 MeV for this case), but I can live with that, since it highlights the instabilities.
However, if I try to save the canvas as pdf c_noKmod_phi100.pdf (81.8 KB), eps, or psc_noKmod_phi100.ps (75.4 KB), I only see the axis or the TGraphs with positive values.
Indeed, Adobe Reader 9 says “An error exists on this page”, and even Inkscape do not draw TGraphs with negative values (but shows the ones with positive values that do not appear in Adobe or Evince).
The only solution I found is to remove the negative points from the TGraphs before plotting them, then the pdf works correctly in any program.

Best,
Claudio


ROOT Version: 6.19/01
Platform: Ubuntu 16.04
Compiler: GCC 5.4.0


Can you post a macro reproducing the problem ? you sent only the images produced.

Sorry for the delay.

Here is a simple minimal macro reproducing the problem, and the corresponding images:

void neg_graph_log()
{
   TGraph *g = new TGraph();
   for (int i = 0; i < 100; ++i)
   {
      double x = pow(10., i/99.);
      double y = 10*pow(x, -2.);
      g->SetPoint(i, x, y);
   }
   g->SetLineColor(kBlue);
   g->SetLineWidth(2);

   TGraph *g_neg = (TGraph *)g->Clone();
   g_neg->GetY()[2] = -10;
   g_neg->GetY()[10] = -100;
   g_neg->SetLineColor(kRed);

   TH1 *h = new TH1F("h", "Good", 10, pow(10, -0.05), pow(10, 1.05));
   h->SetMinimum(pow(10, -1.1));
   h->SetMaximum(pow(10, 1.1));

   TH1 *h_neg = (TH1 *)h->Clone("h_neg");
   h_neg->SetTitle("Bad");

   TCanvas *c = new TCanvas;
   c->Divide(2, 1);   

   c->cd(1);
   h->Draw();
   gPad->SetGrid();
   gPad->SetLogx();
   gPad->SetLogy();
   g->Draw("L SAME");

   c->cd(2);
   h_neg->Draw();
   gPad->SetGrid();
   gPad->SetLogx();
   gPad->SetLogy();
   g_neg->Draw("L SAME");

   c->Print("neg_graph_log.png");
   c->Print("neg_graph_log.pdf");
}

neg_graph_log.pdf (15.4 KB)

Your macro gives me this:

And what about the pdf?
Are you on root 6.20?

the same

Yes. I am using master.

Ok, I’ll try to update root and see what happens.

Updating root to current master solved the problem.

1 Like

This topic was automatically closed 14 days after the last reply. New replies are no longer allowed.