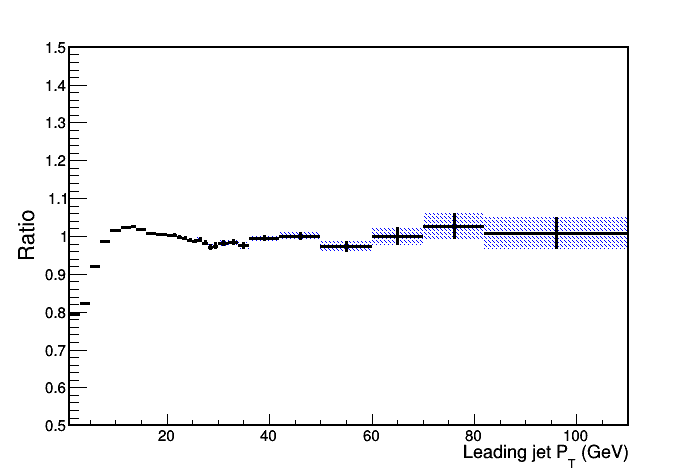
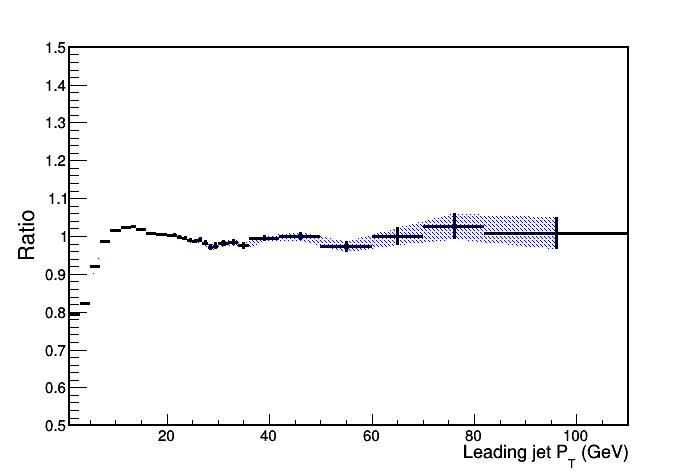
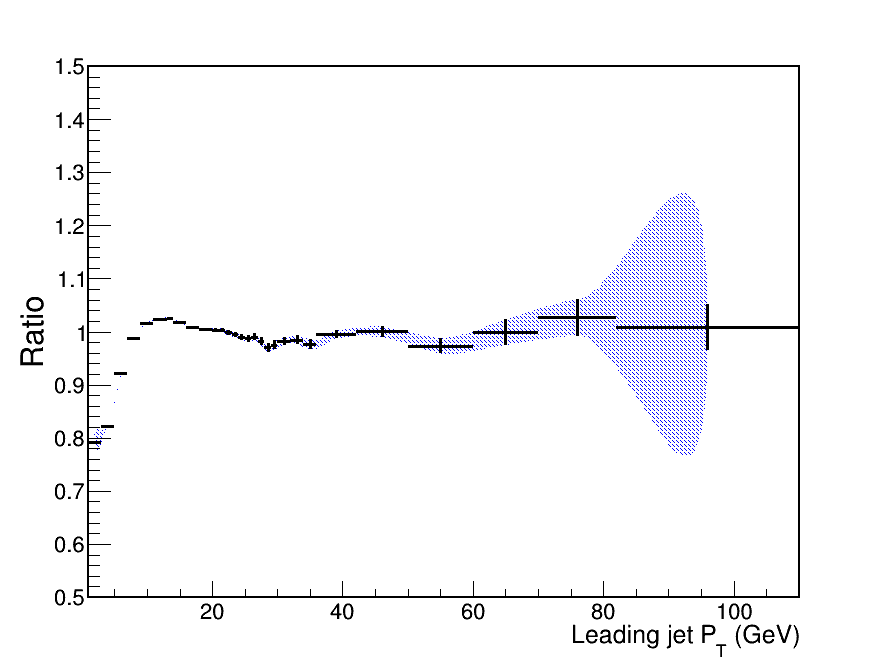
Im plotting a ratio of two histograms and I want to show the errors with option e4, however this options makes the error of the last bin larger than it is. In the figures attached I have plotted the histogram with error bars and three additional options: e2, e3 and e4 (shaded areas). As can be seen, shaded areas from e2 and e3 options are exactly the same as the vertical bars. However, when I use e4 option the shaded area for the very last bin becomes very large. Why is this happening?
Sorry, but I still dont understand why e3 and e4 are different only in the last bin. The description of e3 and e4 is the same. The only difference is the word “smoothed”. Or maybe Im missing something?
Because of the smoothing algorithm used, some artefacts may appear at the end of the band like in the following example. In such cases “E3” should be used instead of “E4”.