I am performing a 2D fit in histFactory, and I would like to obtain the pulls in 2D to inspect the quality of the fit bin-by-bin.
So far I have not found a build-in function for this purpose, so I wanted to compute the 2D pulls myself. However, my problem is that I do not manage to create a histogram from the fitting model.
The fitting model is RooSimultanous, created like this:
RooStats::ModelConfig* modelConf = (RooStats::ModelConfig*)workSpace->obj("ModelConfig");
RooSimultaneous* model = (RooSimultaneous*)modelConf->GetPdf();
where the two variables are extracted as RooRealVar :
I’m surprised that you’re saying “HistFactory” and “2D fit” in one sentence, because as far as I know, HistFactory only supports 1D fits in multiple channels. Maybe that’s what you mean?
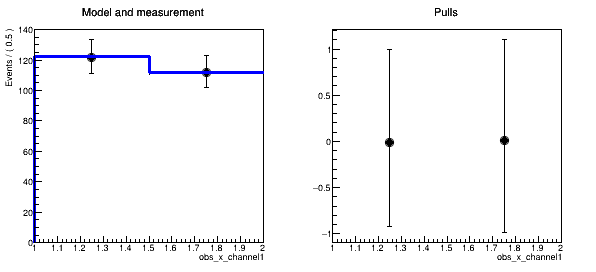
Anyway, for HistFactory you always have one RooRealSumPdf for each observable, which you can plot together with the data and get a pull histogram like in this RooFit tutorial.
You just got to Print the workspace and figure out what the names of the RooRealSumPdfs are. Here some code snippet that you could append to the hf001 example to get the pull distribution for that case:
  // Now, do the measurement
  auto ws = MakeModelAndMeasurementFast( meas );

  ws->Print();
  ws->arg("channelCat")->Print();

  RooRealVar& x = *ws->var("obs_x_channel1");

  auto frame1 = x.frame(RooFit::Title("Model and measurement"));
  auto frame2 = x.frame(RooFit::Title("Pulls"));

  // Plot only the data in that observable's channel
  ws->data("obsData")->plotOn(frame1, RooFit::Cut("channelCat==channelCat::channel1"));
  ws->pdf("channel1_model")->plotOn(frame1); // and this is the RooRealSumPdf

  RooHist *hpull = frame1->pullHist();
  frame2->addPlotable(hpull, "P");

  TCanvas *c1 = new TCanvas("c1", "c1", 600, 300);
  c1->Divide(3);

  c1->cd(1);
  frame1->Draw();

  c1->cd(2);
  frame2->Draw();

  c1->SaveAs("plot.png");

  delete ws;
The plot would look like this, but I’m sure you can style it better
I am not sure if we mean the same thing when we say “2D fit with histFactory”. What I do and which is supported by histFactory is to fit in two variables, i.e. I use 2D histograms of signal and backgrounds as the “samples” to be fitted. As I understand the term “channel” (in the context of histFactory) is that it is a disjoint selection region in data, so in my case there is only one channel, but two observables. Does that make sense?
So I think, I am more or less doing what you suggested, i.e. I get the pull histograms for each of the two observables defined in my first message. However, what I would like to obtain is the pulls for each bin in both observables (not for observable 1 integrated over observable 2), such that I can inspect the quality of the fit in each bin of the fit.
This is why I would like to obtain the fit model as a 2D histogram (with the model uncertainties), such that I can compute the pulls in 2D by myself. Do you know a way to do this?
I found a (very not optimal) solution, which is to plot observable 1 in the range of variable 2 corresponding to a specific bin of observable 2. To do this I use the “RooFit::ProjectionRange(“bin_range_of_obs_2”)”. However, since I have 20 x 20 bins, I would have to repeat this twenty times, and then I get 20 different pull plots, and this is not ideal, since I would like to have one single 2D pull plot. However, maybe I could make this work, if I could just extract the raw values from the pull histograms and then make 2D pull plot myself, but I don’t manage to extract the content and error of the pull histogram (this is a RooHist object). Do you know how to get this information from a RooHist object?
However, this function returns a histogram with too large uncertainties. I have attached a plot of the projections in each of the two observables and another plot with the the same projections using the plotOn() function, which gives correct uncertainties.