Dear experts,
I am having some problems with the observed upper limits calculated with roostats. In attachment, you find the code of a toy, that well represents my problem.
With “do_workspace_pdf.C” I am building the model, and the limit_calc_pdf.C calculates the expected and observed upper limit.
The model is built with
w->factory("SUM::total_model(N_data*Bkg_Model_Full_pdf,n_signal*signal_pdf)");
Bkg_Model_Full_pdf is the background pdf, whose shape is obtained by fitting real data with a polynomial function.
Data are in this toy generated by sampling the Bkg_Model_Full_pdf
RooDataHist *data=Bkg_Model_Full_pdf.generateBinned(y,2036834);
If I calculate the observed and expected upper limits, I see that they almost coincide, as I expect since I generated data from the same pdf I used to calculate the expected U.L.
However, in the do_workspace_pdf.C you can see that there are other two pdf for the background model, HighHistForSyst4_pdf and LowHistForSyst4_pdf. If you plot them you will see a very small difference between them and Bkg_Model_Full_pdf, since they have been obtained by varying the polynomial coefficient of the background of +1 sigma or -1 sigma. Indeed, by calculating the expected upper limit I see very few differences between the different models.
My question is the following: I tried to see what happens if I generate the data with
RooDataHist *data=HighHistForSyst4_pdf.generateBinned(y,2036834);
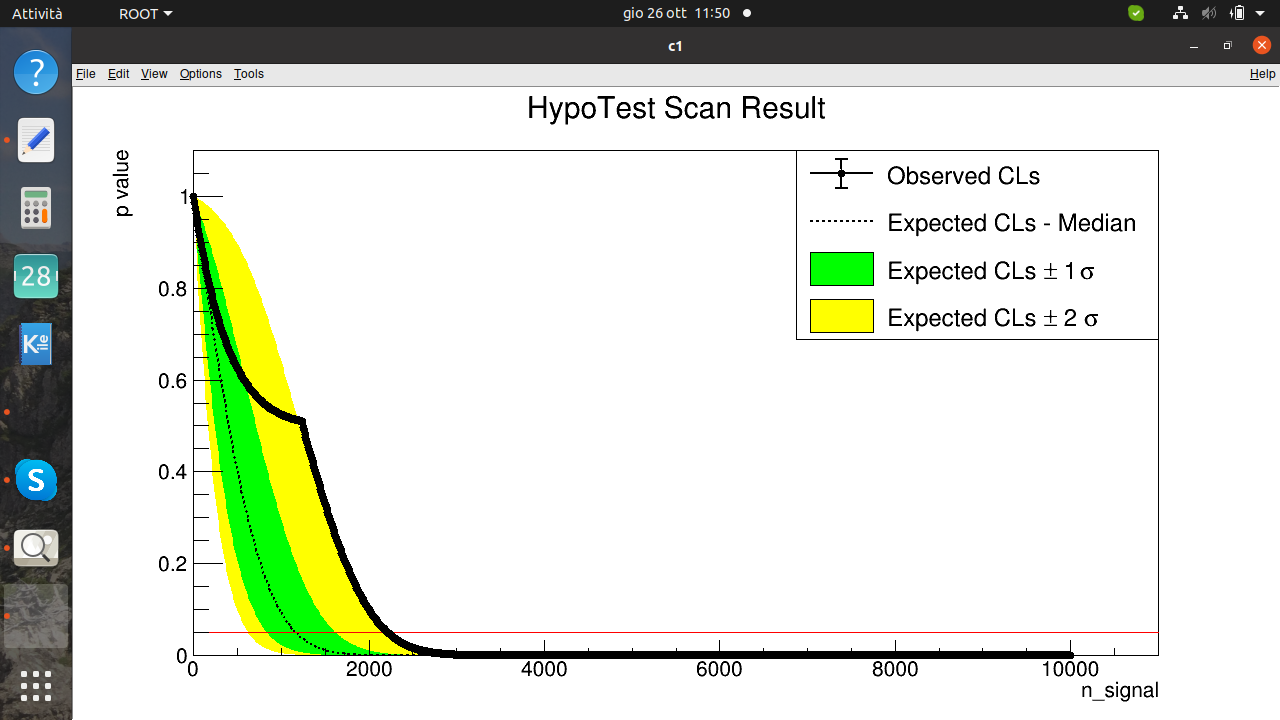
while keeping the same “total model” built with the Bkg_Model_Full_pdf and I see a very strange shape in the observed upper limit, I put the picture in attachment.
When I generate data with LowHistForSyst4_pdf, I see that the obs limit is a bit different from Bkg_Model_Full_pdf, but it seems ok.
I would like to understand why the UL with the HighHistForSyst4_pdf becomes like that. I saw that very often, in the HighHistForSyst4_pdf, the fit to data seems to fail, I report here the output:
AsymptoticCalculator::EvaluateNLL - value = -1.95963e+07 for poi fixed at = 1616.16
[#0] PROGRESS:Eval – OBSERVED DATA : qmu = -2.82388 condNLL = -1.95963e+07 uncond -1.95963e+07
[#0] WARNING:Minimization – AsymptoticCalculator: Found a negative value of the qmu - retry to do the unconditional fit
AsymptoticCalculator::EvaluateNLL - value = -1.95963e+07
[#0] WARNING:Minimization – AsymptoticCalculator: Found a better unconditional minimum old NLL = -1.95963e+07 old muHat 1515.15
[#0] WARNING:Minimization – AsymptoticCalculator: New minimum found for NLL = -1.95963e+07 muHat 1616.16
[#0] PROGRESS:Eval – After unconditional refit, new qmu value is 0
[#0] PROGRESS:Eval – AsymptoticCalculator::GetHypoTest – Find best conditional NLL on ASIMOV data set …
AsymptoticCalculator::EvaluateNLL - value = -1.96094e+07 for poi fixed at = 1616.16
[#0] PROGRESS:Eval – ASIMOV data qmu_A = 7.314 condNLL = -1.96094e+07 uncond -1.96094e+07
[#0] PROGRESS:Eval – poi = 1616.16 qmu = 0 qmu_A = 7.314 sigma = 597.595 CLsplusb = 0.5 CLb = 0.996579 CLs = 1.99316
< CLs = 0.501716 +/- 0
< CLb = 0.996579 +/- 0
< CLsplusb = 0.5 +/- 0
Can you do please some tests to verify if I am doing something wrong?
I don’t expect so much difference between the models…
limit_calc.zip (8.0 KB)
Or have you any suggestion?
Thank you,
Laura