Hello,
I am trying to do an unbinned extended maximum likelihood fit into multiple sidebands on a 2-dimensional data-set.
I have followed following Roofit tutorials:
1> ROOT: tutorials/roofit/rf312_multirangefit.C File Reference
2> rf204a_extrangefit_RooAddPdf.C
The relevant part of the code is :
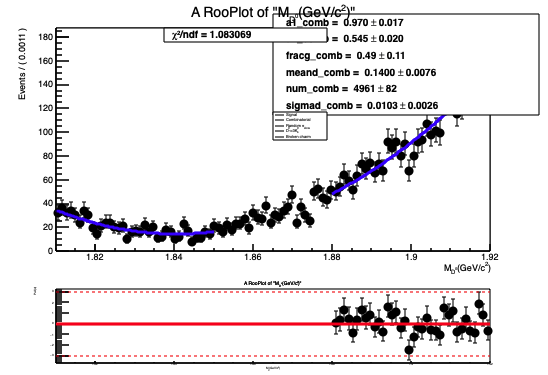
Fit variables are : M_dz and deltam
Part I: (setting the sideband range)
//------------mdz left side-band----------//
M_dz.setRange("sbml",1.81,1.85);
deltam.setRange("sbml",0.14,0.15);
//------------mdz left side-band----------//
M_dz.setRange("sbmr",1.88,1.92);
deltam.setRange("sbmr",0.14,0.15);
//-----fitting---------//
// to extend pdf RooAddPdf is used as suggested in https://root.cern/doc/v610/rf312__multirangefit_8C.html
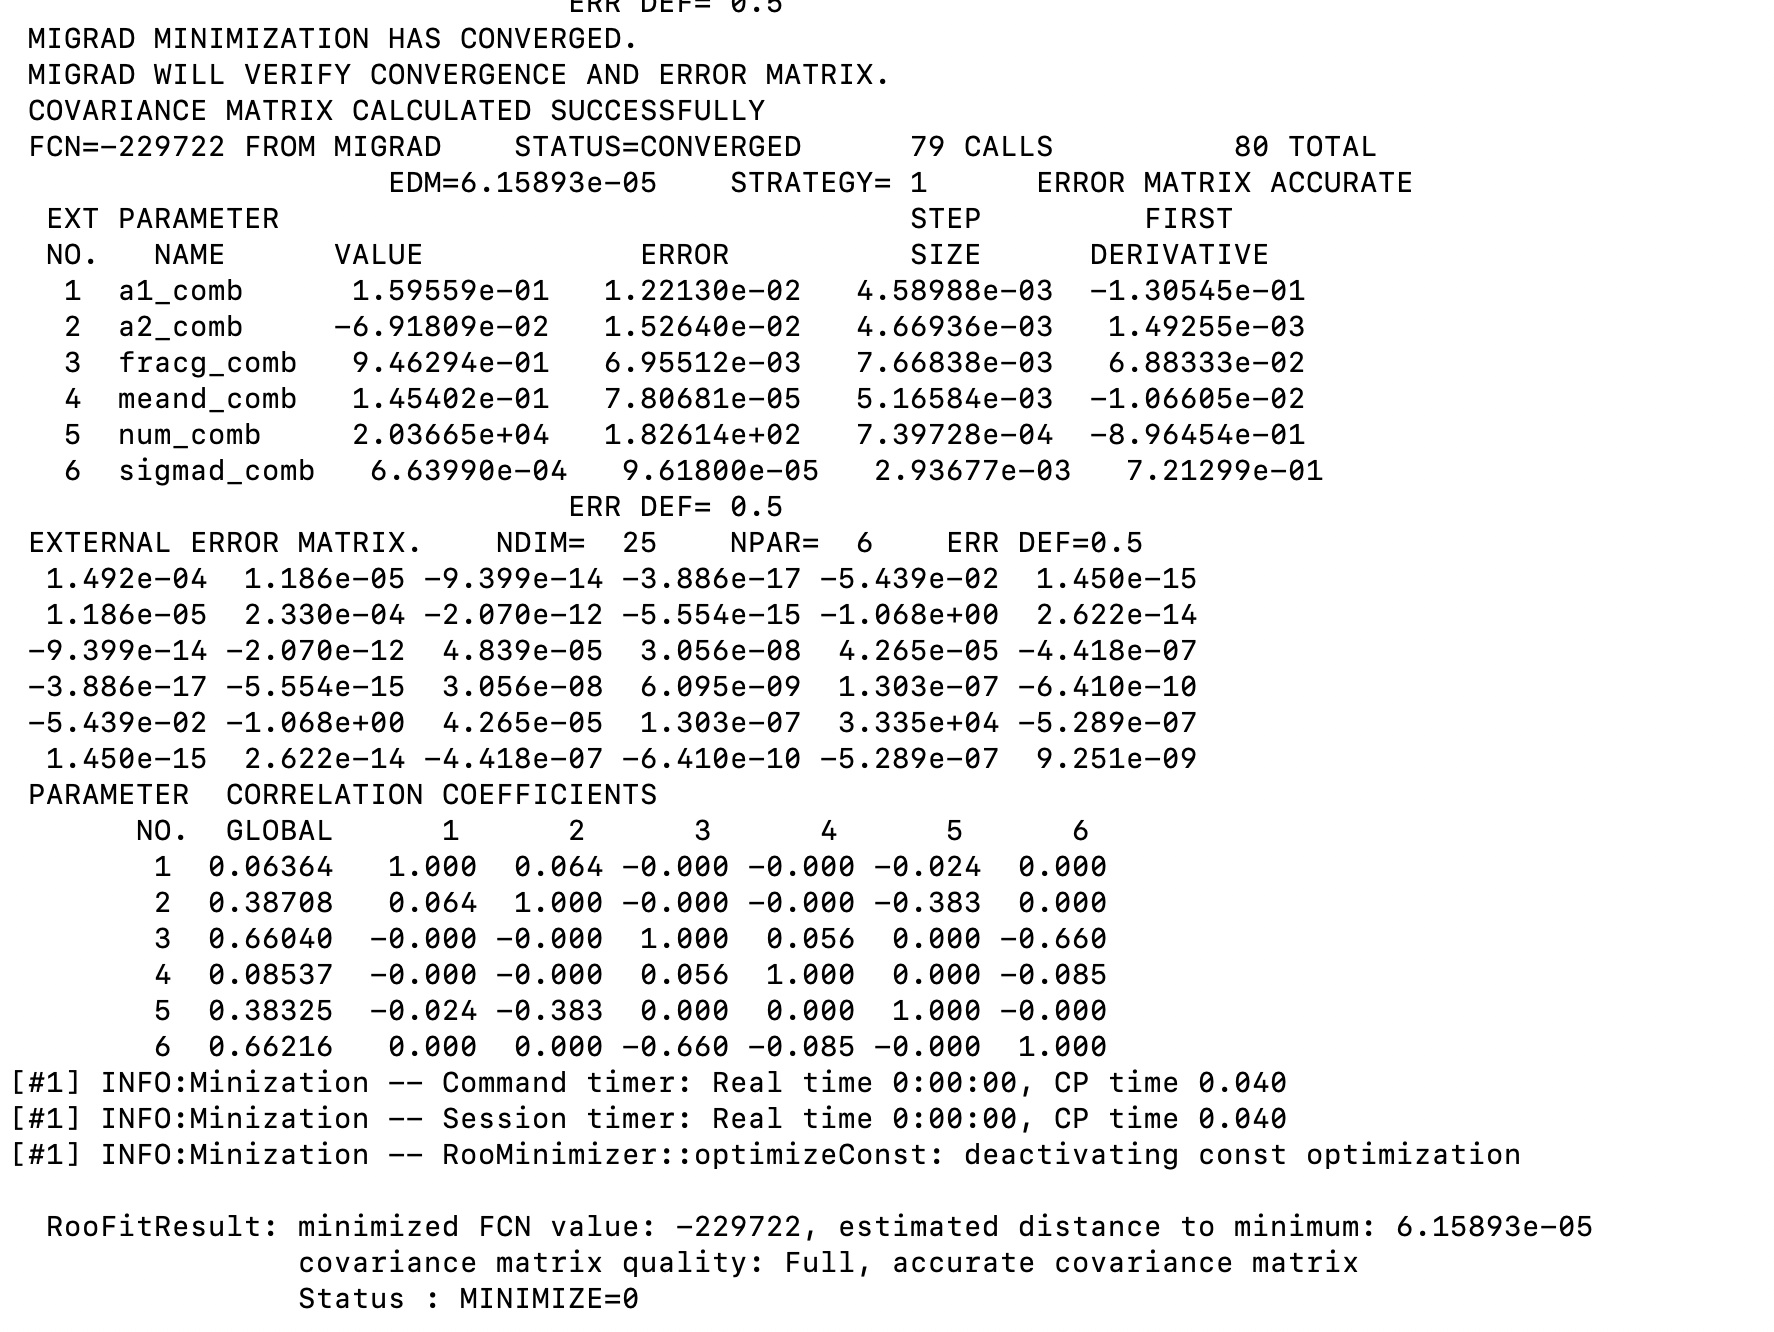
RooFitResult *rs1 =mdzdel1.fitTo(*ds1,Range("sbml,sbmr"),Extended(kTRUE), Minos(0),Hesse(0), NumCPU(4),Save(),Timer(kTRUE));``
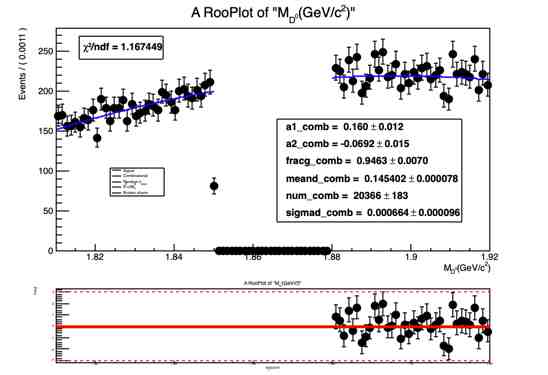
//-------plotting-------//
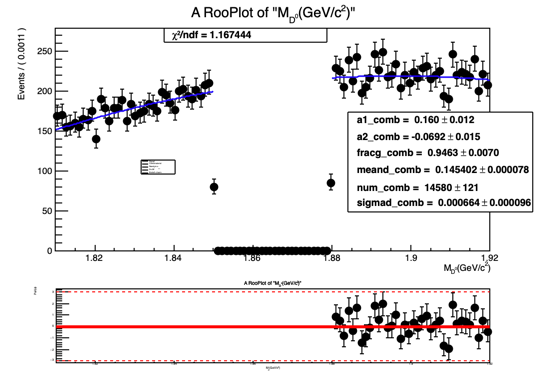
RooPlot *mdz_frame = M_dz.frame();
ds1->plotOn(mdz_frame);
mdzdel1.plotOn(mdz_frame, Range("sbml,sbmr"),NormRange("sbml,sbmr"),LineColor(kBlue), LineStyle(kSolid));
mdzdel1.paramOn(mdz_frame);
const double nData = ds1->sumEntries(" ", "sbmr,sbml");
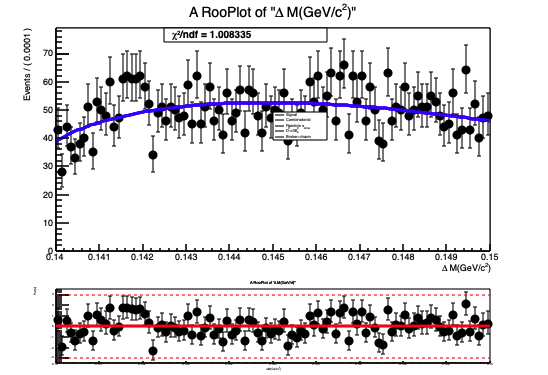
RooPlot *deltam_frame = deltam.frame();
ds1->plotOn(deltam_frame);
mdzdel1.plotOn(deltam_frame, Range("sbml,sbmr"),NormRange("sbml,sbmr"), LineColor(kBlue), LineStyle(kSolid),Normalization(nData, RooAbsReal::NumEvent));
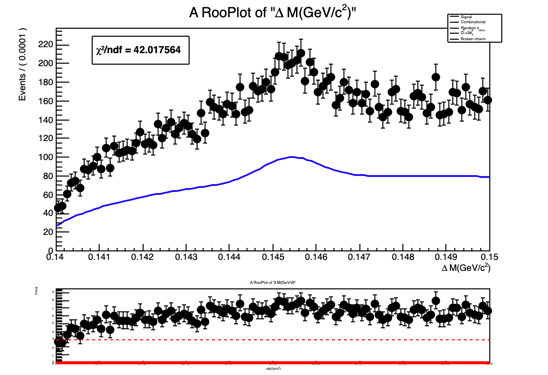
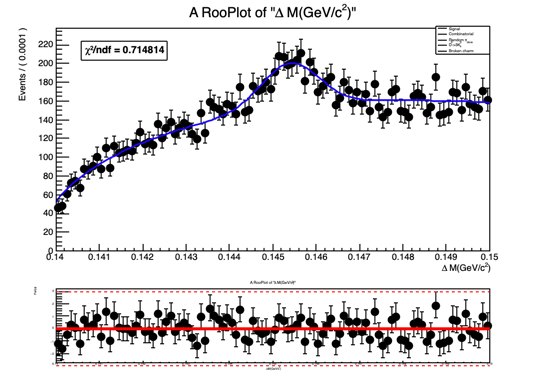
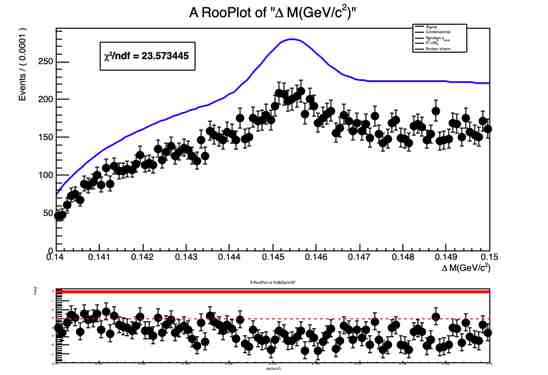
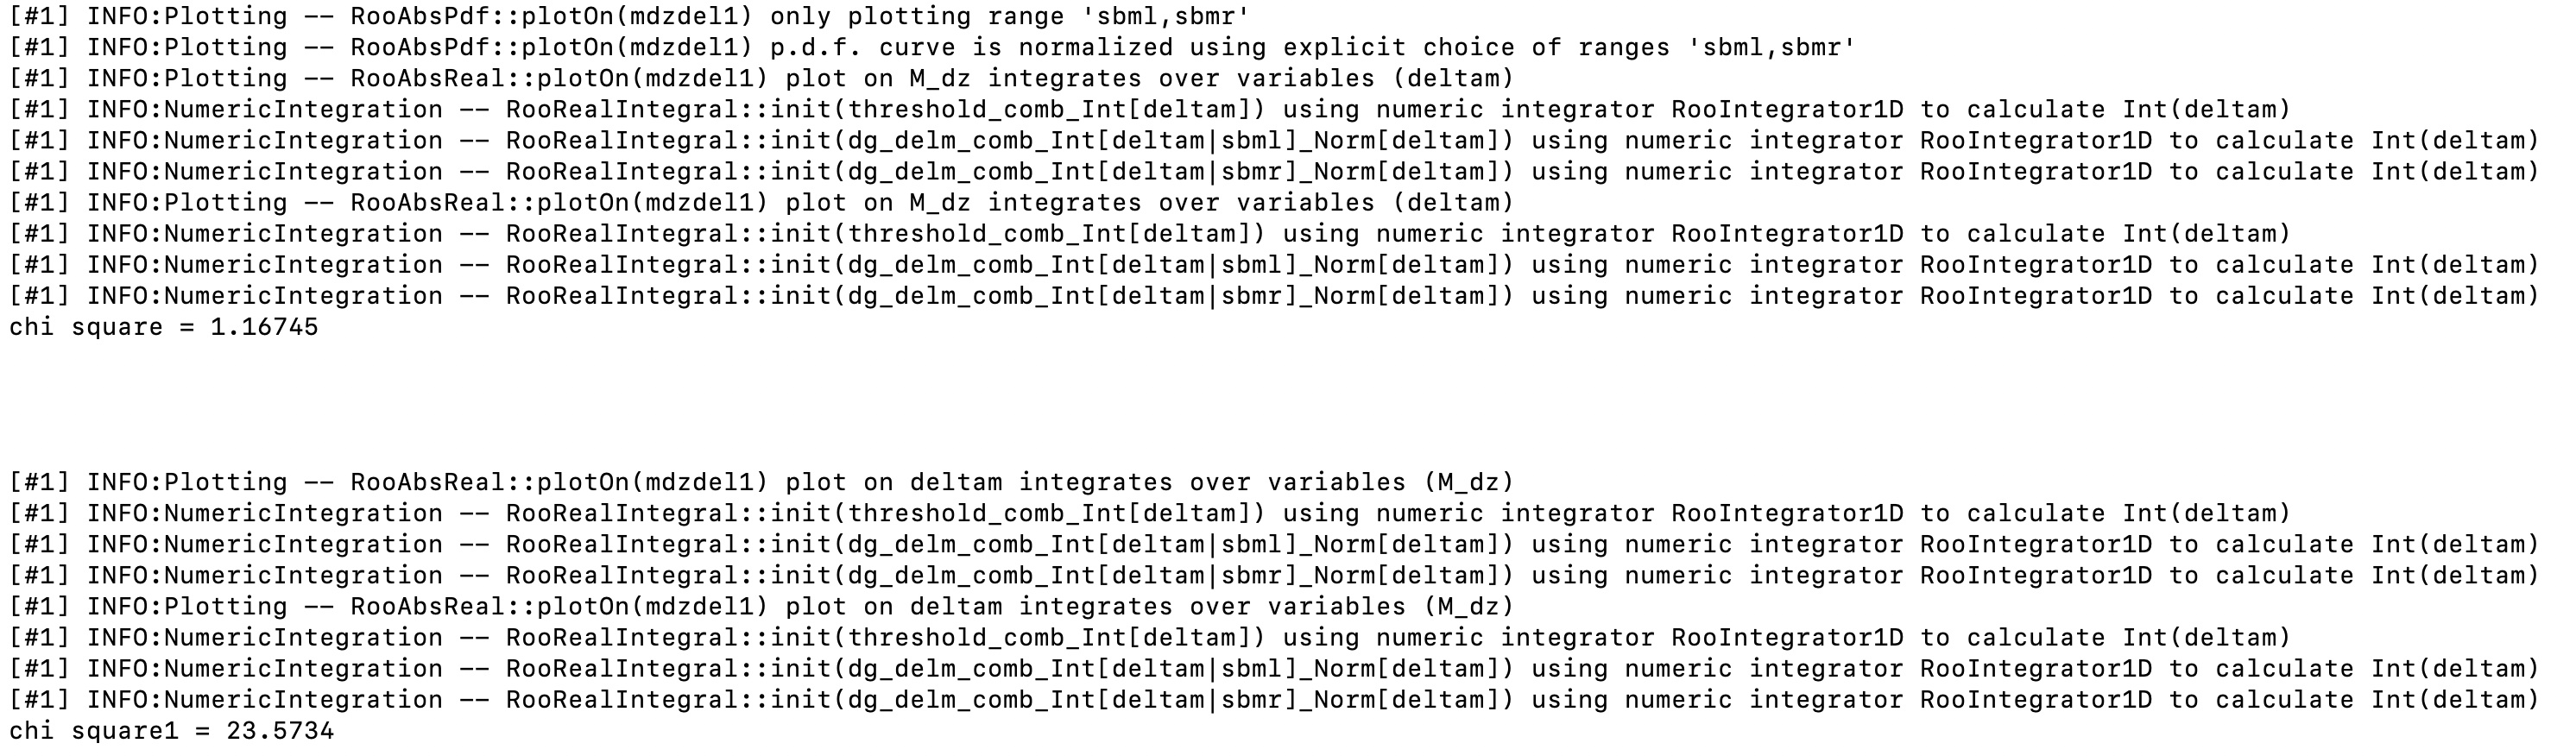
The normalization(yield) obtained from fit doesn’t look right and so is the fit projection for variable deltam (see attached document deltam.pdf or fig. below)
I have found a similar problem reported here :
I have implemented the suggested solution but it’s not working.
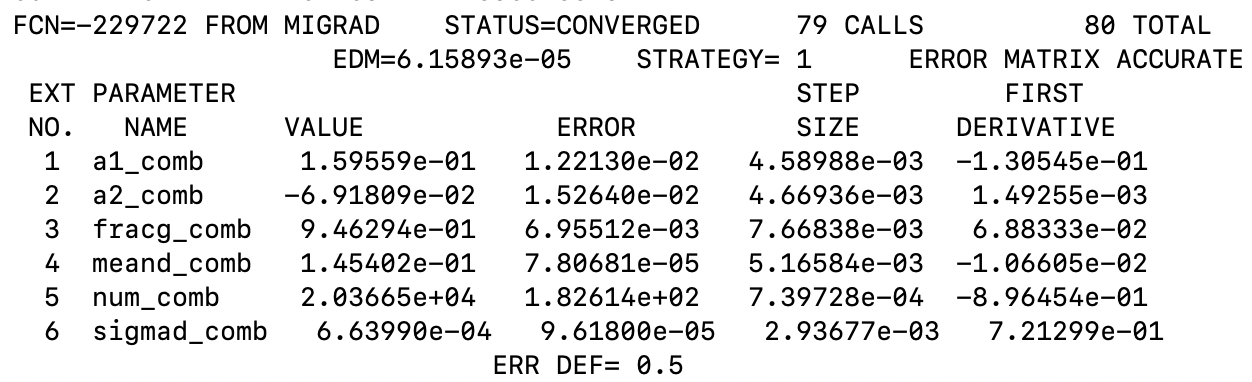
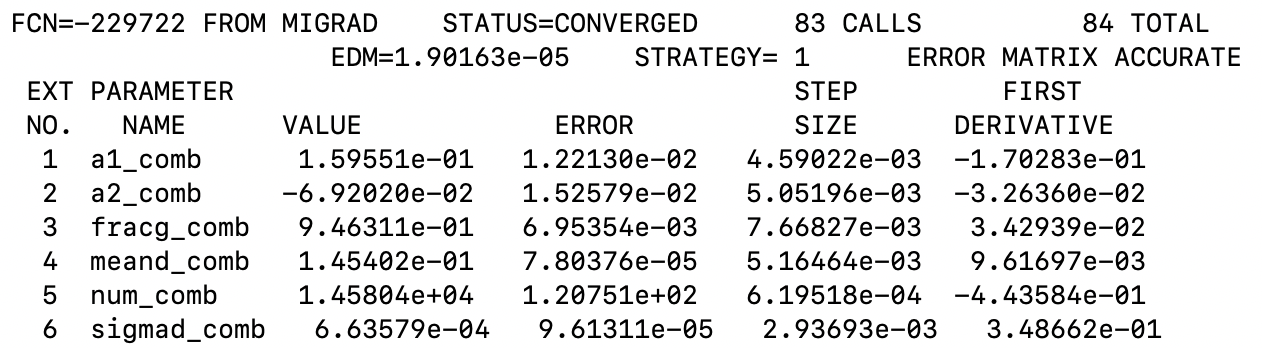
I do not get any warning regarding the normalization of fit projection. (see attached snapshots
I am attaching the fit macro part4_all1.C part4_all1.C (23.1 KB) ,
logfile sb_fit.txt (101.7 KB)
deltam fit projection deltam.pdf (33.3 KB)
M_dz fit projection Mdz.pdf (27.7 KB)!