Dear experts,
I would like to extract a 2D histogram from a tree using a TTree::Project() function and got a problem.
It seems that the projected histogram has much less entries compared to what I would get using a TTree::Draw() function.
## go to the sample directory, this link should allow you to access it
## https://cernbox.cern.ch/index.php/s/9Z2gt2QKyIFTz5v
cd /eos/user/s/sandrean/ntuples/stop1L/background/mc16d_ttZ
python
from ROOT import *
from array import array
tree = TChain("mc16d_ttZ_Nom")
tree.Add("*.root")
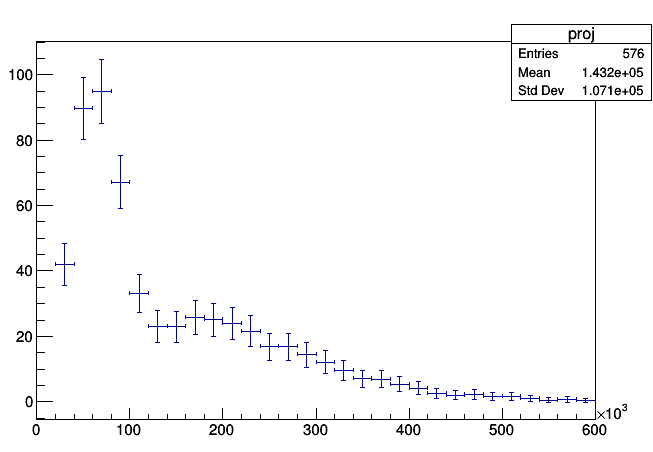
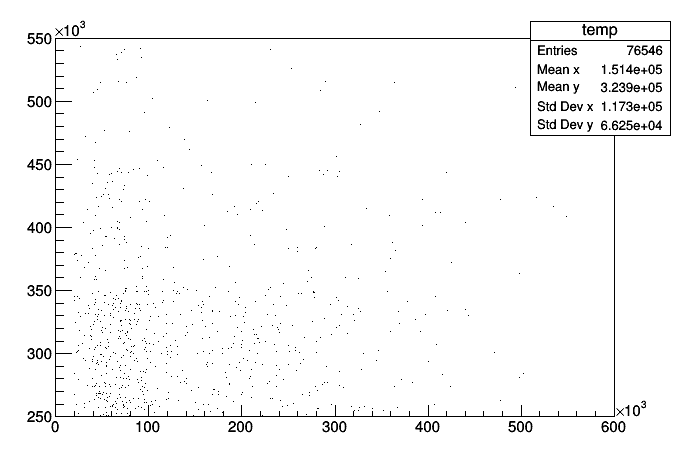
h_temp = TH2D("temp", "", 30, 0, 600e3, 3, array('d',[250e3, 350e3, 450e3, 550e3]))
tree.Project("temp", "met:mt", "(stxe_trigger==1 && lep_pt[0]>25e3 && n_jet>3 && jet_pt[0]>25e3 && jet_pt[1]>25e3 && jet_pt[2]>25e3 && jet_pt[3]>25e3 && met>230e3 && dphi_jet0_ptmiss>0.4 && dphi_jet1_ptmiss>0.4 && mt>30e3 && (mT2tauLooseTau_GeV>80||mT2tauLooseTau_GeV<0)&&1) * (1) * weight * xs_weight * sf_total * weight_sherpa22_njets * 150000")
h_temp.Draw()
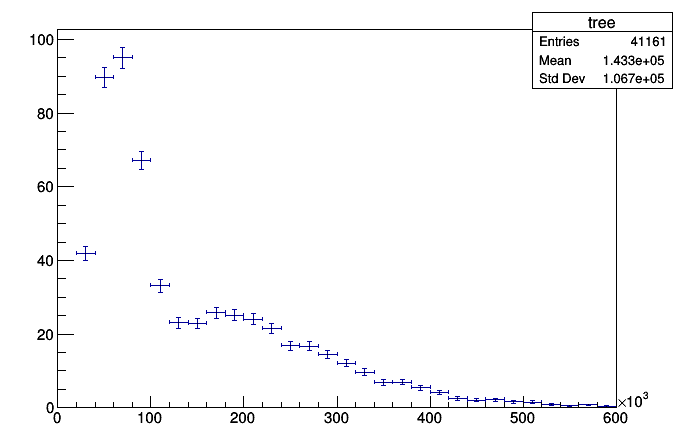
Compare this if I just do:
tree.Draw("met:mt", "(stxe_trigger==1 && lep_pt[0]>25e3 && n_jet>3 && jet_pt[0]>25e3 && jet_pt[1]>25e3 && jet_pt[2]>25e3 && jet_pt[3]>25e3 && met>230e3 && dphi_jet0_ptmiss>0.4 && dphi_jet1_ptmiss>0.4 && mt>30e3 && (mT2tauLooseTau_GeV>80||mT2tauLooseTau_GeV<0)&&1) * (1) * weight * xs_weight * sf_total * weight_sherpa22_njets * 150000")
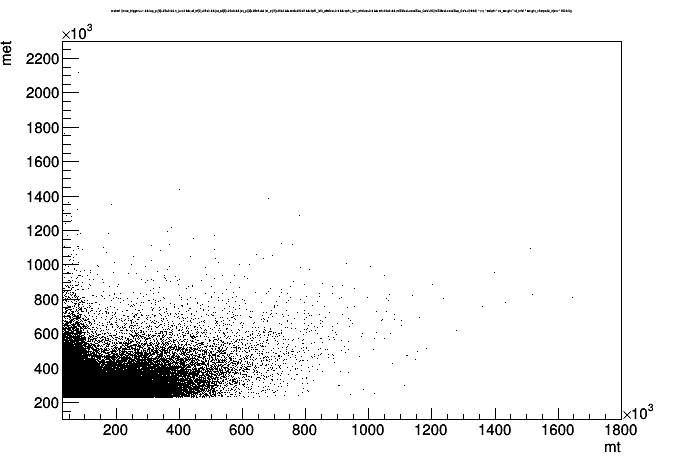
Clearly, the second plot has more data points in it, despite having the same cut and weights!
Hoping to get some clarity from the forum.
Thanks!
Best,
Yosse
ROOT Version: 6.10
Platform: lxplus
Compiler: Not Provided