I am trying to draw a TGraph with an uncertainty band around it (I use MultiGraph for the band). Nevertheless, I want to draw the band as a smooth curve, by using “AFC”, but the edges of the band blow up when I do that. If I only use AF it draws it fine but the band is not an smooth curve. I will appreciate your ideas/thoughts.
 TGraph *band = new TGraph(2*val+1);

   for (int i=0;i<val;i++)
     {
       band->SetPoint(i,x[i],error_up[i]);
       band->SetPoint(i+val,x[val-1-i],error_down[val-1-i]);
     }
   mg->Add(band);
   mg->Draw("AFC");
Can you provide a running macro ? the points’ values are missing in the example you posted.
I am not sure what you mean by “the edges of the band blow up when I do that”
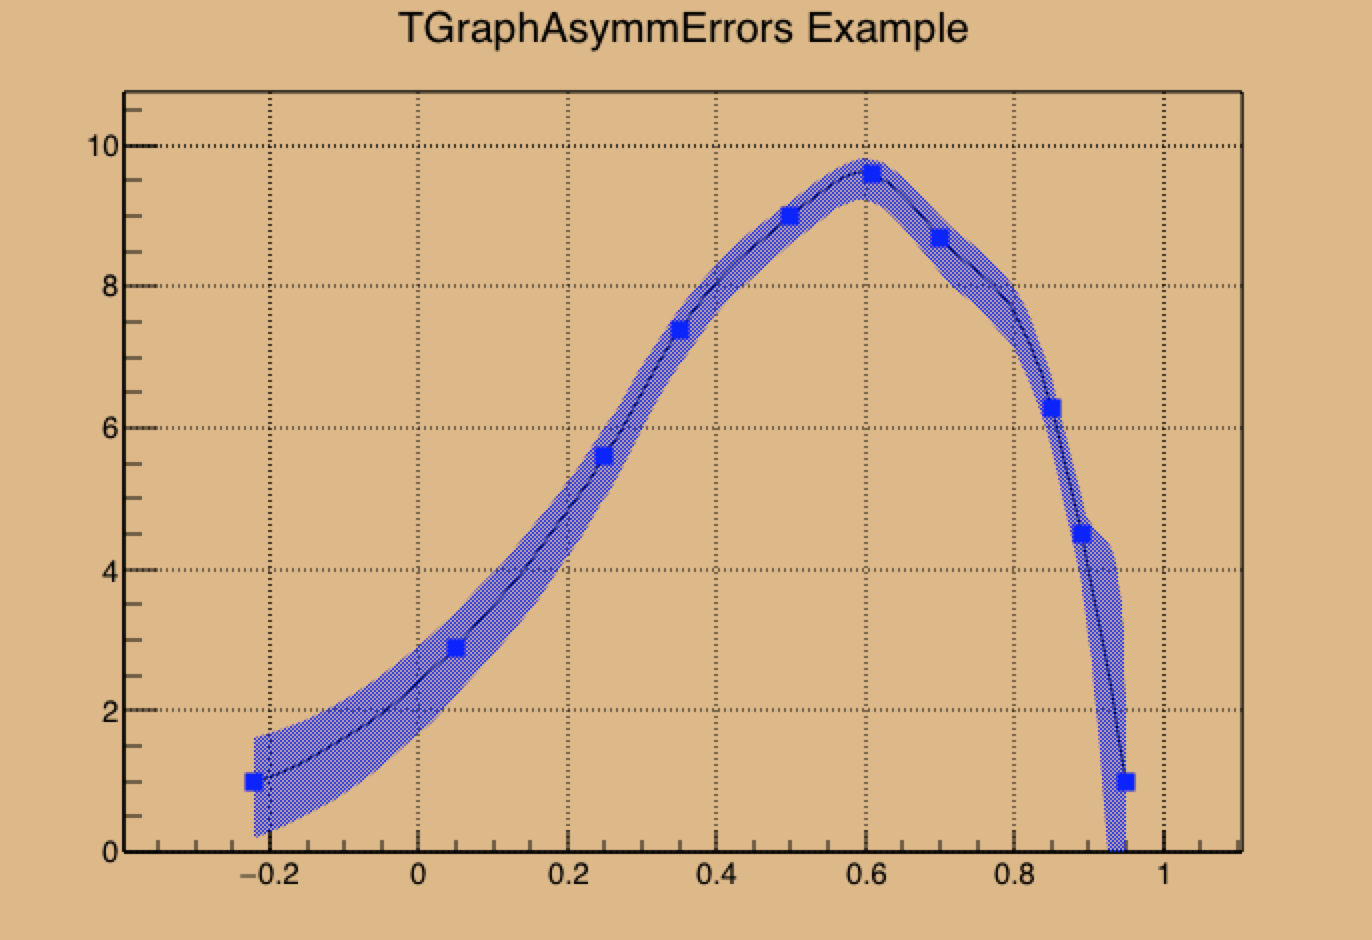
Hi @Andres_Florez. I think you want to use TGraphAsymmErrors or TGraphErrors using SetPoint for the central point and SetPointError for the band, using the “A3C” Draw Option.
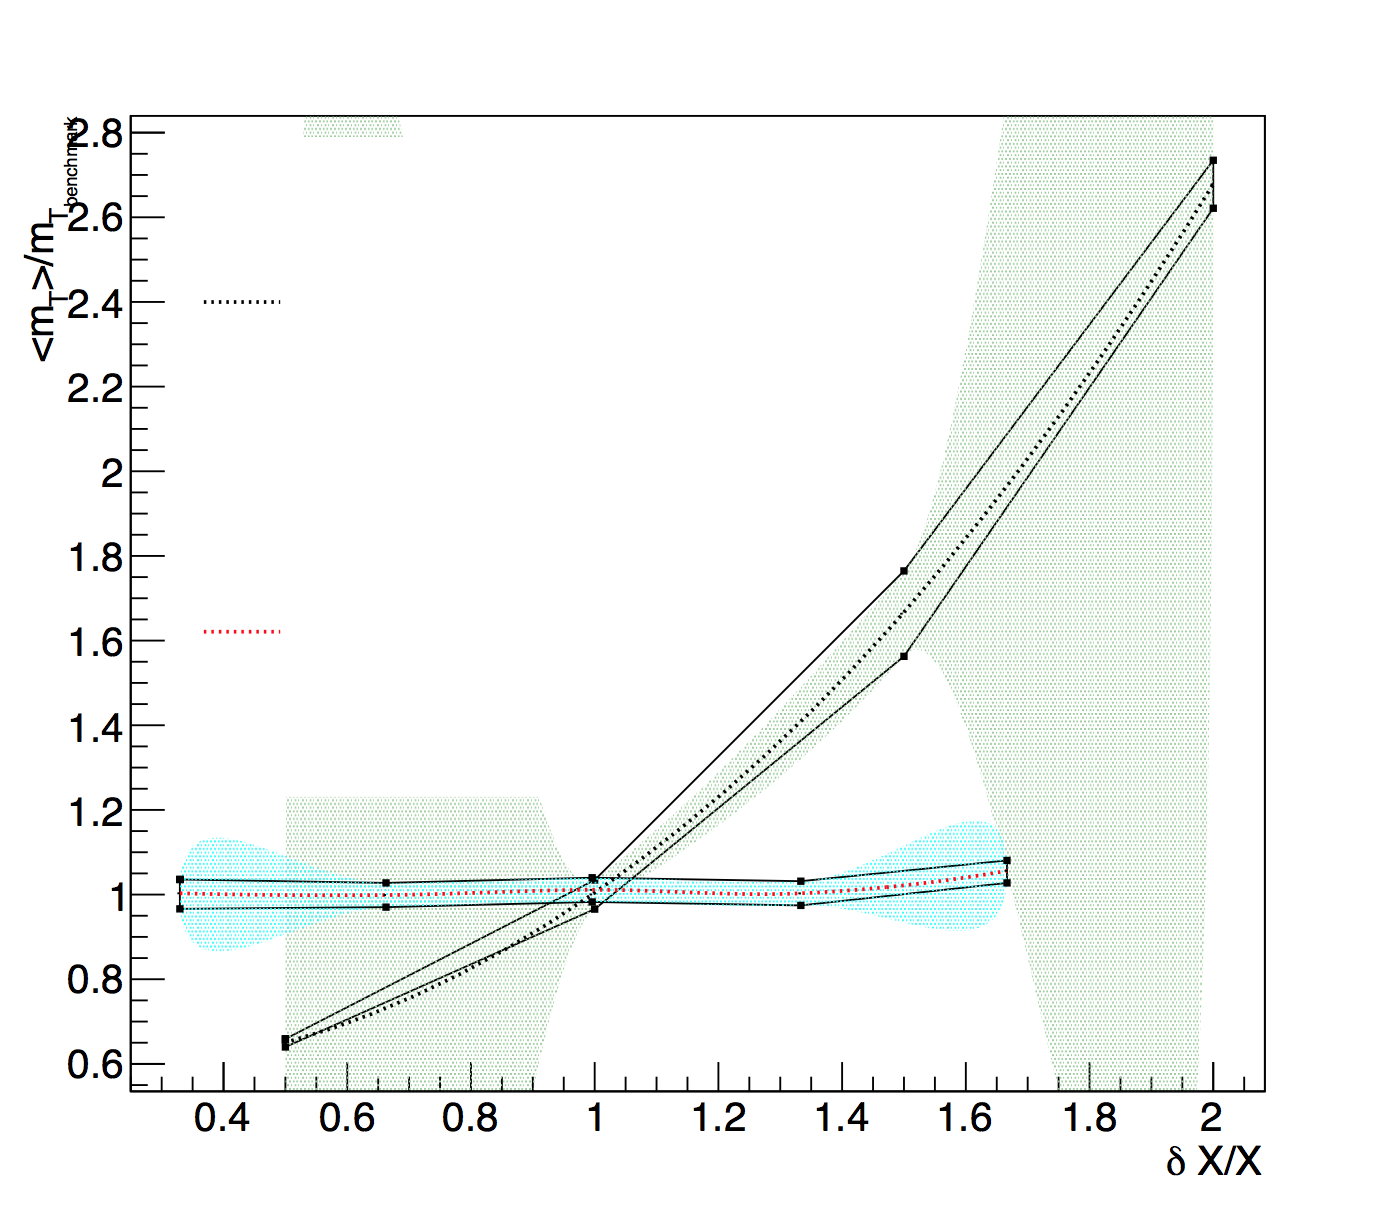
Thank you! I have looked at the options you refer, but actually I do not get what I want. With the TGraph, I get the same as with TGraphAsymmErrors. I want a smooth band. I ran the example you sent in the first link with the “A3C” option and I do not get the smooth band I expected. Please see below the plot I get with the TGraph:
I plotted your graph showing the points you use for the error band.
My idea is: in order to have a smooth curve at the limit of your plot root creates these bubbles to allow the curve to be smooth above and below the curve.
If you want to use this method I think you should use more points, especially close to the beginning and the end of the plot.