Problem with small values in TGraph2D

Hi,

This is probably a trivial problem and the solution may already be known.
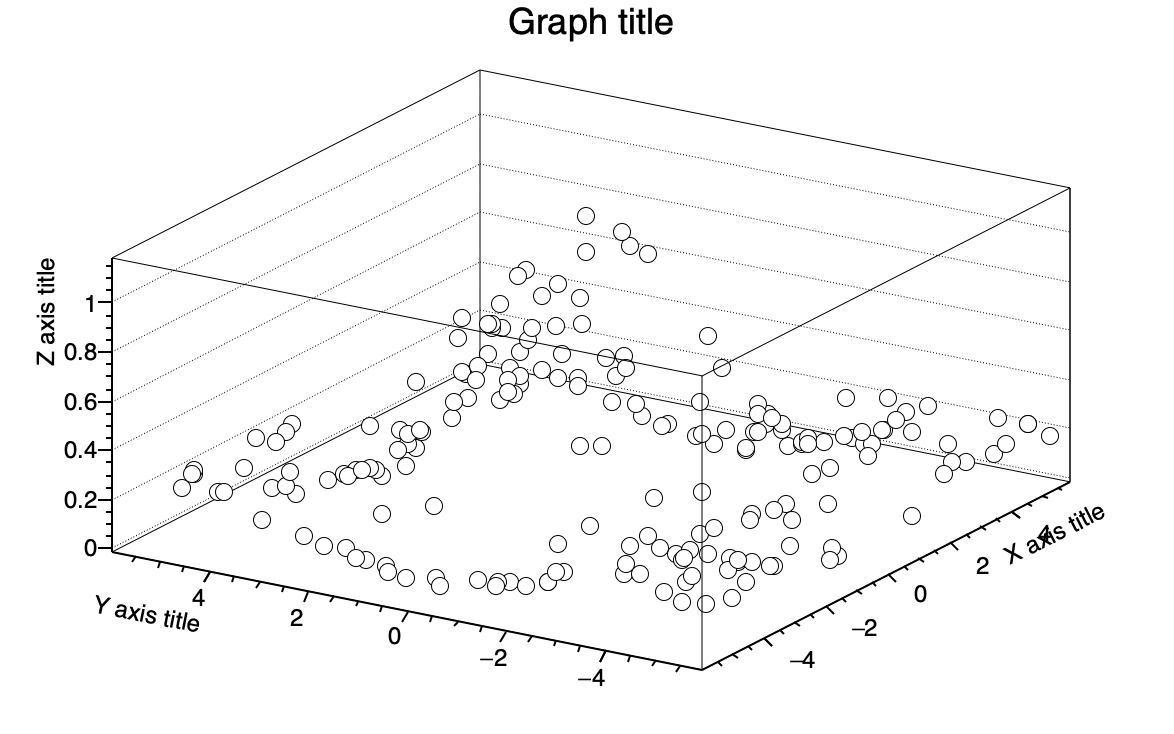
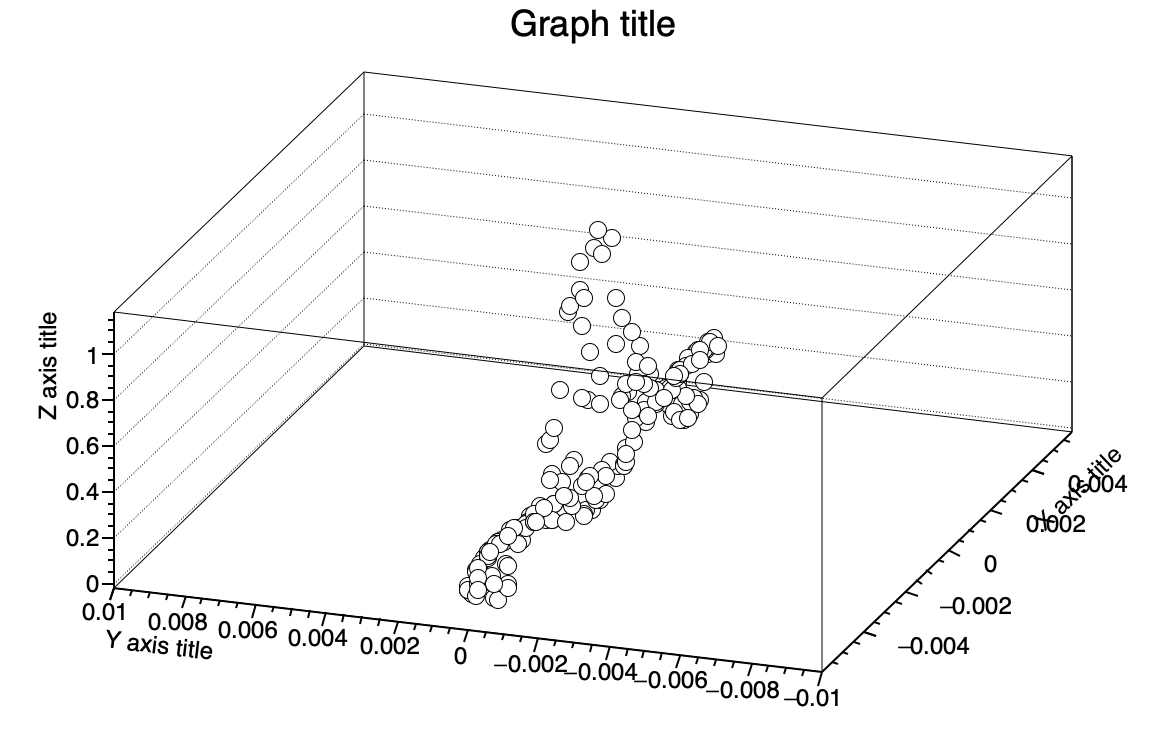
I see that there is a problem in filling small values in TGraph2D. I write here two sets of codes which can show the problem. [1] is with the normal values and works. [2] is with values scaled by 10^-4 and 10^-7.
In [2] you can see that the gaussian structure is not visible and only flat surface is visible.

I tried changing the range of the axis, but it doesnt work.

Does anyone have a fix to it?

ROOT Version: 6.22/08

Thanks
Shilpi

[1] Working one

{

    TCanvas *c = new TCanvas("c","Graph2D example",0,0,600,400);
    Double_t x, y, z, P = 6.;
    Int_t np = 200;
    TGraph2D *dt = new TGraph2D();
    dt->SetTitle("Graph title; X axis title; Y axis title; Z axis title");
    TRandom *r = new TRandom();
    for (Int_t N=0; N<np; N++) {
      x = 2*P*(r->Rndm(N))-P;
      y = 2*P*(r->Rndm(N))-P;
      z = (sin(x)/x)*(sin(y)/y)+0.2;                                                                                                                                                                                   
      dt->SetPoint(N,x,y,z);
    }
    gStyle->SetPalette(1);
    dt->Draw("surf1");
    return c;


}


[2]

When filled with small values

{

    TCanvas *c = new TCanvas("c","Graph2D example",0,0,600,400);
    Double_t x, y, z, P = 6.;
    Int_t np = 200;
    TGraph2D *dt = new TGraph2D();
    dt->SetTitle("Graph title; X axis title; Y axis title; Z axis title");
    TRandom *r = new TRandom();
    for (Int_t N=0; N<np; N++) {
      x = 2*P*(r->Rndm(N))-P;
      y = 2*P*(r->Rndm(N))-P;
      z = (sin(x)/x)*(sin(y)/y)+0.2;
      dt->SetPoint(N,x*10e-4,y*10e-7,z);                                                                                                                                                                                                  
    }
    gStyle->SetPalette(1);
    dt->Draw("surf1");
    return c;


}

I tried with option P0 instead of surf1. this option simply plots the dots with a marker at the position you gave. It looks like [1] gives a Gaussian but [2] gives a flat cloud of points all in the same plane.

[1]

[2]

thanks for the check. So I suppose the axis should be changed?
I wonder this should have picked the appropriate range of axis on its own. However this doesn’t seem to be the case. I essentially need to draw contours later on. With these small values, it doesn’t have a graph associated with it. Essentially contLevel->GetSize() = 0

Would you have a suggestion?

Thanks
Shilpi

 {

    TCanvas *c = new TCanvas("c","Graph2D example",0,0,600,400);
    Double_t x, y, z, P = 6.;
    Int_t np = 200;
    TGraph2D *gr2d = new TGraph2D();
    gr2d->SetTitle("Graph title; X axis title; Y axis title; Z axis title");
    TRandom *r = new TRandom();
    for (Int_t N=0; N<np; N++) {
      x = 2*P*(r->Rndm(N))-P;
      y = 2*P*(r->Rndm(N))-P;
      z = ((sin(x)/x)*(sin(y)/y)+0.2)*100;
      gr2d->SetPoint(N,x*10e-4,y*10e-7,z);
                                                                                                                                                                                                        
    }
    gStyle->SetPalette(1);                                                                                                                                                                                                         
    double clev = 2.3;
    gr2d->GetHistogram()->SetContour(1, &clev);
                                                                                                                                                                                           
    gr2d->Draw("CONT LIST");                                                                                                                                                                                                       
    gPad->Update();


    TObjArray *contours = (TObjArray *)gROOT->GetListOfSpecials()->FindObject("contours");
    assert(contours);

    TList *newlist = 0;
    cout<<"Number of contours "<<contours->GetEntriesFast()<<endl;

    for (int ci=0; ci<contours->GetEntriesFast(); ci++) {
      TList *contLevel = (TList*)contours->At(ci);
      printf("%f: Contour %d has %d Graphs\n", clev, ci, contLevel->GetSize());

      if (contLevel->GetSize()) {
        assert(contLevel->First());
        TGraph *curv = (TGraph*)(contLevel->First());
                                                                                                                                                                                                            
      }
    } // contour loop                                                                                                                                                                                                                        


}

I will have a closer look.

you can do:

{
   auto c = new TCanvas("c","Graph2D example",0,0,600,400);
   Double_t x, y, z, P = 6.;
   Int_t np = 200;
   auto dt = new TGraph2D();
   auto h2 = new TH2D("h2","h2",100,-9*10e-4,9*10e-4,100,-9*10e-7,9*10e-7);
   dt->SetTitle("Graph title; X axis title; Y axis title; Z axis title");
   dt->SetHistogram(h2);
   TRandom *r = new TRandom();
   for (Int_t N=0; N<np; N++) {
      x = 2*P*(r->Rndm(N))-P;
      y = 2*P*(r->Rndm(N))-P;
      z = (sin(x)/x)*(sin(y)/y)+0.2;
      dt->SetPoint(N,x*10e-4,y*10e-7,z);
   }
   dt->Draw("P0"); // work
   //dt->Draw("TRI"); // crash
}

But the TRI option (using the Delaunay triangles which are also used to fill the histogram) crashes. I have no explanation for the time being.

This topic was automatically closed 14 days after the last reply. New replies are no longer allowed.