Problem with SetRangeUser in TGraphErrors drawing

Dear Root experts,
I’m observing a graphic problem while trying to plot a TGraphErrors with error bands (I’m using root_v6.11.02)
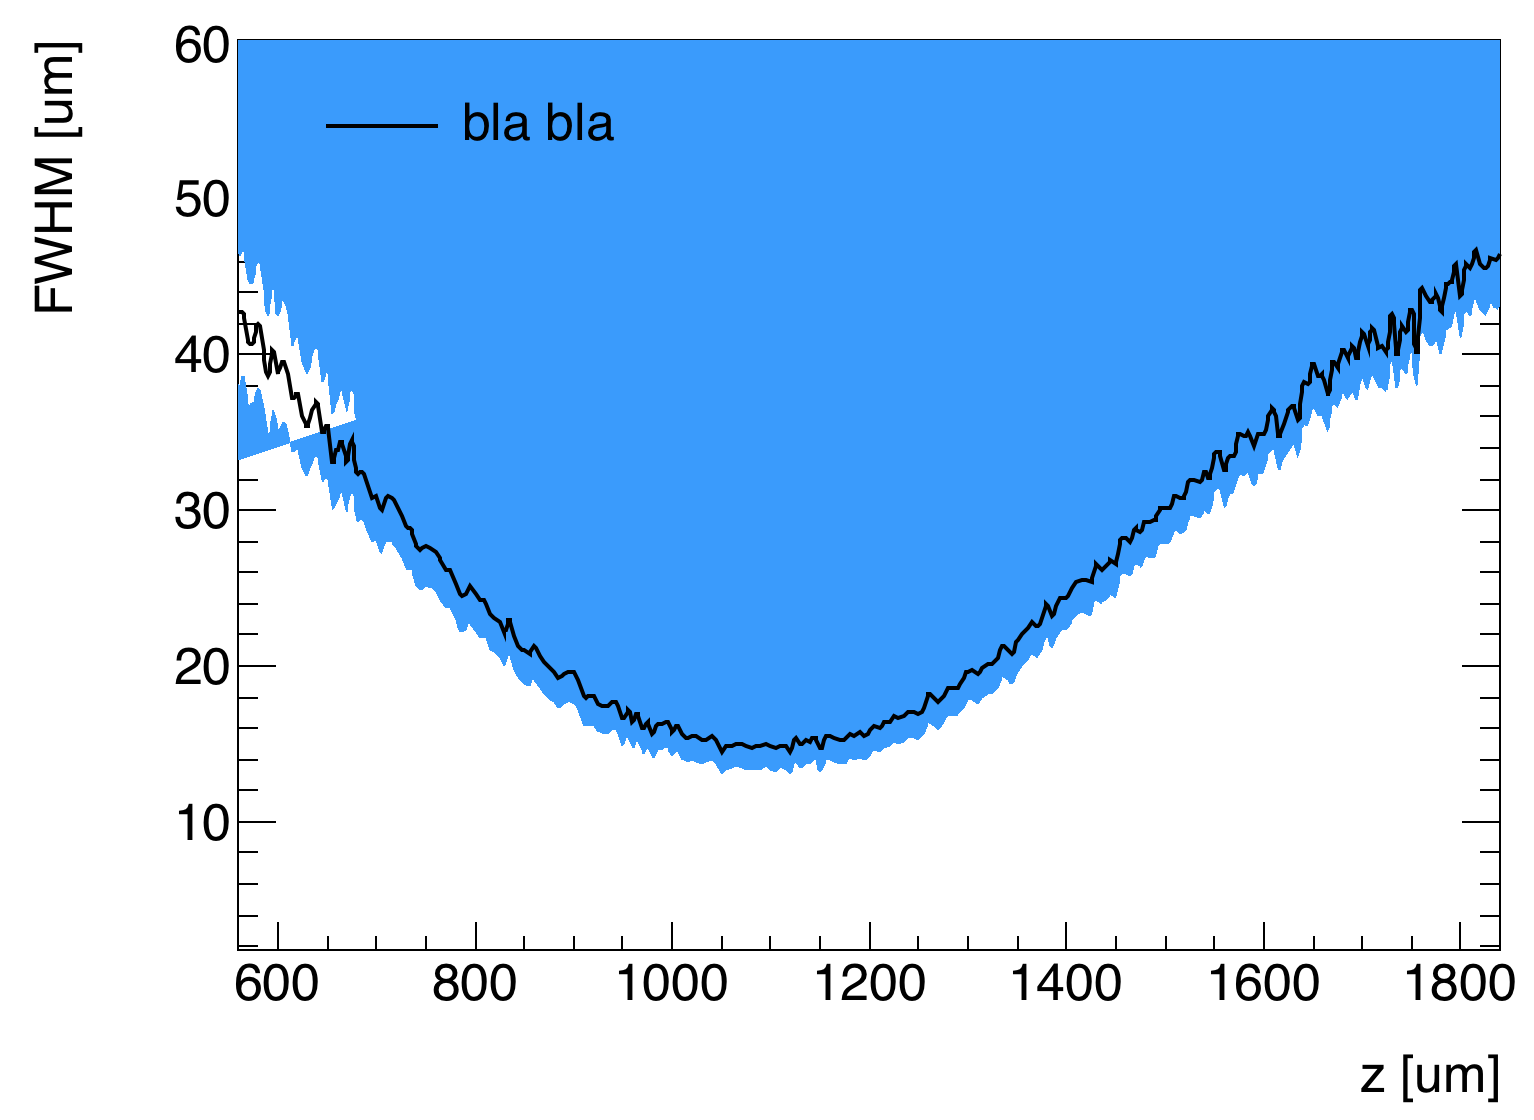
My plot looks fine if I don’t touch the axis ranges, but when I try to change them I end up with this:


(unfortunately the forum doesn’t let me upload two pictures)

I use the following code for changin the axis:

graph_vec.at(0)->GetXaxis()->SetRangeUser(600, 1800);
graph_vec.at(0)->GetYaxis()->SetRangeUser(0, 80);

(but the same behaviour happens if I do it by hand with the mouse from the canvas)

and these line for the drawing:

graph_vec.at(0)->Draw("a4");
graph_vec.at(0)->Draw("same c X");

I think it is an extrapolation problem, since everything work fine if I use:

graph_vec.at(0)->Draw("a3");

Do you have any suggestion on how to fix this?
I also attach a root file with the raw TGraph, maybe it could help
laserprofile.root (12.8 KB)

Many thanks for your help,
Claudia

you should load them one by one.

I am looking at you problem now. I might well be that in that case the clipping of the polygon is wrong.

Yes you should use A3 as explained here.

I made the following macro:

void cmerlass() {
   auto f = new TFile("laserprofile.root");
   auto *g = (TGraphErrors*)f->Get("Graph");
   g->SetFillColor(kBlue-10);
   g->GetXaxis()->SetRangeUser(600, 1800);
   g->GetYaxis()->SetRangeUser(0, 60);
   g->Draw("a3");
   g->Draw("c X");
}

I get this picture:

and by the way I get the same picture with A4

Thanks!
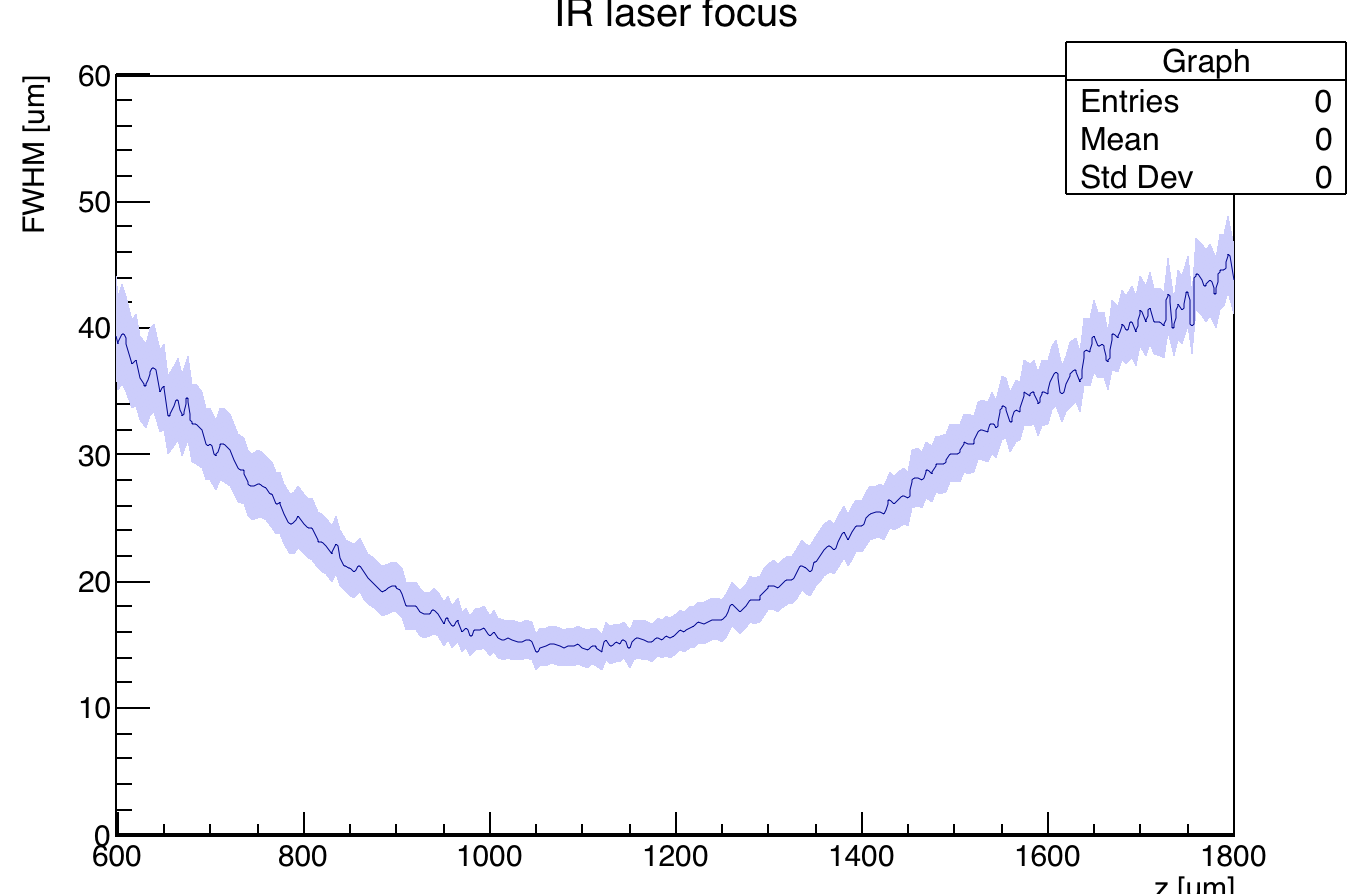
In the end I found a range that is good for my plot and for which the figure doesn’t break even with a4. I just wanted to report that it may be a bit unstable, I agree that “a3” is a safer option.

Cheers,
Claudia

Well, the ranges you sent me work both with A3 and A4… may be you have an old ROOT version in which there was a problem. I am using the master and it is fine.

This topic was automatically closed 14 days after the last reply. New replies are no longer allowed.