Hello,
I’m trying to customize my plots by modifying margin and label size and offset. I started form a style I didn’t write.
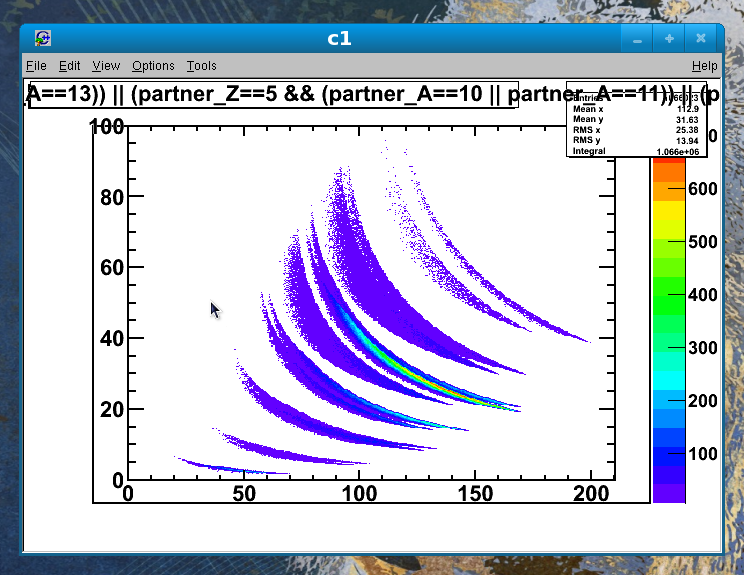
My problem is the following one : I increased the margins of the pad (with “SetPad___Margin”) to get more space for the axis style and use a bigger font. But, there is still a drawing box which stay and with the same dimension of the pad by default. This box is not really a problem itself (it goes away if I ask to hide the title or the statistics or when I save the canvas as a picture). But, if I draws a 2d-plot with the option “colz” to get the coloured bar, this bar does fit the pad but with the box. So, I guess that if I’m able to to modify the box to get the same dimensions that the pad, the colored bar will be ok.
My apologies if I’m not clear enough.
I put below my rootlogon.C and a picture to illustrate my problem.
Thank you for your help,
Xavier
[code]//ild TStyle
TStyle* ildStyle = new TStyle(“ildStyle”, “ILD Style”);
//set the background color to white
ildStyle->SetFillColor(10);
ildStyle->SetFrameFillColor(10);
ildStyle->SetCanvasColor(10);
ildStyle->SetPadColor(10);
ildStyle->SetTitleFillColor(0);
ildStyle->SetStatColor(10);
//dont put a colored frame around the plots
ildStyle->SetFrameBorderMode(0);
ildStyle->SetCanvasBorderMode(0);
ildStyle->SetPadBorderMode(0);
ildStyle->SetLegendBorderSize(0);
//use the primary color palette
ildStyle->SetPalette(1,0);
//set the default line color for a histogram to be black
ildStyle->SetHistLineColor(kBlack);
//set the default line color for a fit function to be red
ildStyle->SetFuncColor(kRed);
//make the axis labels black
ildStyle->SetLabelColor(kBlack,“xyz”);
//set the default title color to be black
ildStyle->SetTitleColor(kBlack);
//set the margins
ildStyle->SetPadBottomMargin(0.15);
ildStyle->SetPadTopMargin(0.10);
ildStyle->SetPadRightMargin(0.15);
ildStyle->SetPadLeftMargin(0.15);
//set axis label and title text sizes
// ildStyle->SetLabelFont(42,“xyz”);
ildStyle->SetLabelSize(0.05,“xyz”);
// ildStyle->SetLabelOffset(0.015,“xyz”);
// ildStyle->SetTitleFont(42,“xyz”);
ildStyle->SetTitleSize(0.05,“xyz”);
ildStyle->SetTitleOffset(1.2,“xyz”);
// ildStyle->SetStatFont(42);
// ildStyle->SetStatFontSize(0.07);
// ildStyle->SetTitleBorderSize(0);
// ildStyle->SetStatBorderSize(1);
// ildStyle->SetTextFont(42);
//set line widths
ildStyle->SetFrameLineWidth(2);
ildStyle->SetFuncWidth(2);
ildStyle->SetHistLineWidth(2);
//set the number of divisions to show
ildStyle->SetNdivisions(506, “xy”);
//turn off xy grids
ildStyle->SetPadGridX(0);
ildStyle->SetPadGridY(0);
//set the tick mark style
ildStyle->SetPadTickX(1);
ildStyle->SetPadTickY(1);
//turn on stats
ildStyle->SetOptStat(1001111);
ildStyle->SetOptFit(1);
//marker settings
ildStyle->SetMarkerStyle(0);
ildStyle->SetMarkerSize(1);
ildStyle->SetLineWidth(2);
//done
ildStyle->cd();
gROOT->ForceStyle();
gStyle->ls();[/code]