Hi, I just installed (despite me) ROOT 6.10 on my pc. Before, I had a root 5.34. And the problems begin.
I compiled this code.
TH1D* Analyse::ThistoPlot(const char* title, const char* Histo, int bin, int colo, int x_min, int x_max)
{
	TH1D* histo = new TH1D(Histo, title, bin, x_min, x_max) ;
	histo->GetXaxis()->CenterTitle() ;
	histo->GetYaxis()->CenterTitle() ;
	histo->SetLineColor(colo+1) ;
	histo->SetMarkerSize(7) ;
	histo->SetLineWidth(3) ;
	histo->SetStats(0);
	histo->GetXaxis()->SetTitleSize(0.05);
	histo->GetYaxis()->SetTitleSize(0.05);
	histo->GetXaxis()->SetTitleOffset(0.9);
	histo->GetYaxis()->SetTitleOffset(0.8);
	histo->GetXaxis()->SetLabelSize(0.04);
	histo->GetYaxis()->SetLabelSize(0.04);
	return histo ;
}

and then

TH1D* amplitud[4] ;
for(int c = 0 ; c < 4 ; c++){
       amplitud[c] = analyse->ThistoPlot(Form("#bf{max spectrum %d};#bf{Channel number};#bf{Normalized
       events}",c+1),Form("spectrum%d",c+1),1000, c,0,4000) ;
}

leg = new TLegend(0.55, 0.75, 0.75, 0.90) ;
C->Clear() ;
gStyle->SetErrorX(0) ;
for(int c = 3 ; c >= 0 ; c--)
{
	if(c!=3){
		amplitud[c]->Scale(1./amplitud[c]->GetMaximum()) ;
		amplitud[c]->Draw("SAME") ;
		leg->AddEntry(amplitud[c], Form("Amplitude for PM %d", c),"l") ;
	}
	else{
		amplitud[c]->Scale(1./amplitud[c]->GetMaximum()) ;
		amplitud[c]->Draw("") ;
		leg->AddEntry(amplitud[c], Form("Amplitude for PM %d", c),"l") ;
	}
}
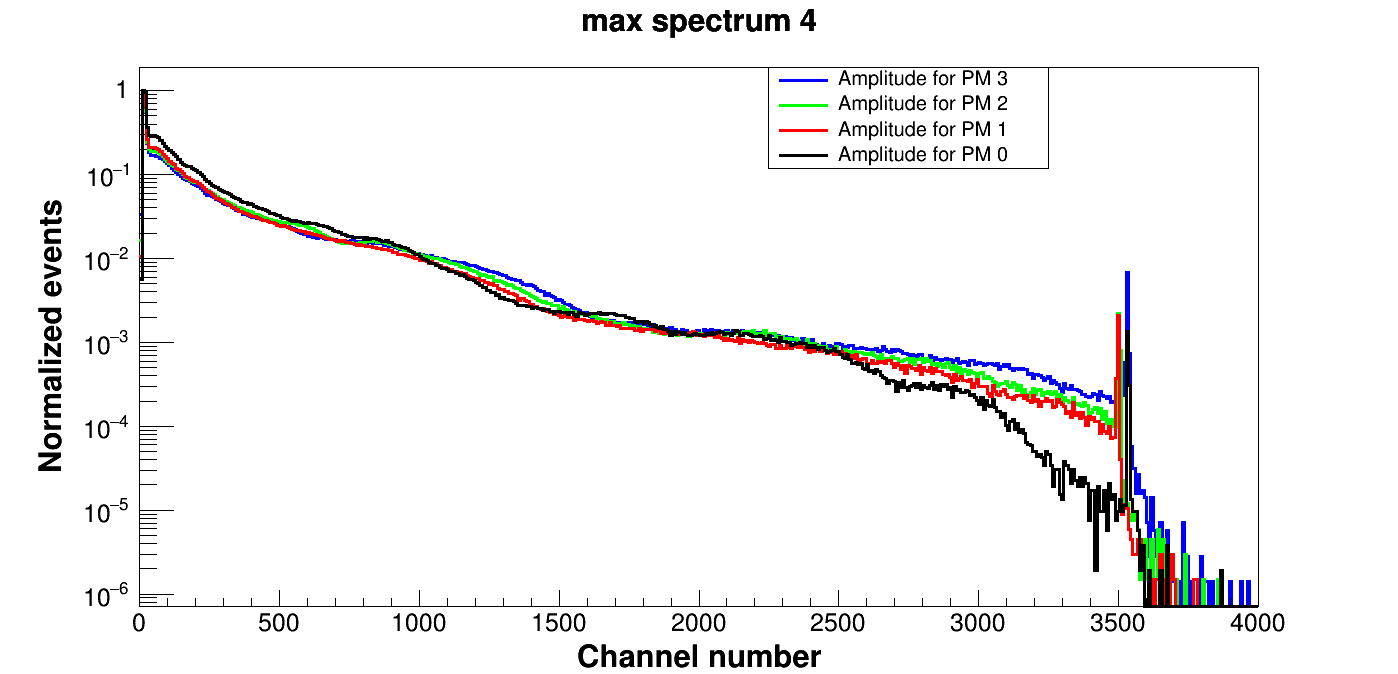
On root5, I get this figure:
And on root6 I get this.
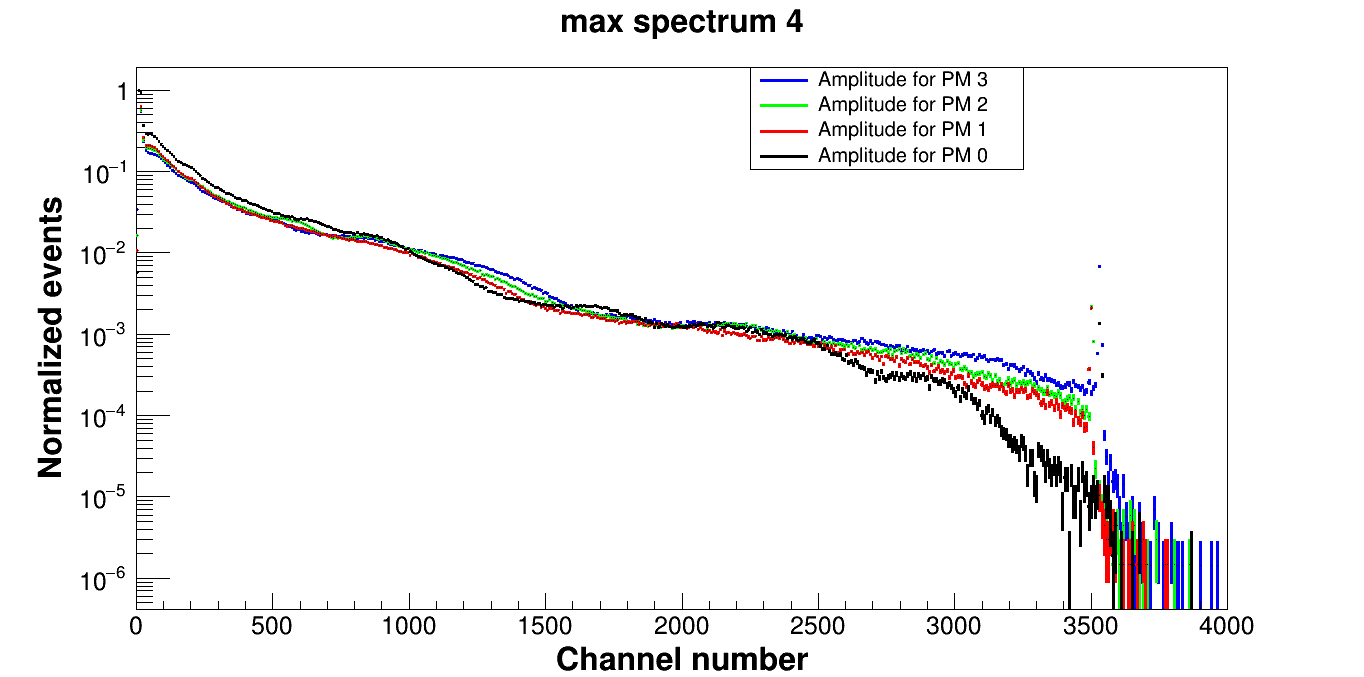
In root6 I can get some plot like this :

I would like to get exactly the same thing as on root5 but I do not know what to do. I tried all the Draw view options (“APCL”) but nothing works. I would like to remove this vertical bar and connect my points.
Any help is appreciated.
best regards.