However, when I do fit the data-bkg histogram ie like
hist_data.Draw()
# Plot bkg+bkg2 (green dashed)
hist_bkg_plus_bkg2 = hist_bkg1.Clone()
hist_bkg_plus_bkg2.Add(hist_bkg2)
hist_bkg_plus_bkg2.SetLineStyle(2)
hist_bkg_plus_bkg2.SetLineColor(ROOT.kGreen)
hist_bkg_plus_bkg2.Draw(" L same") # Draw bkg+bkg2 (green dashed)
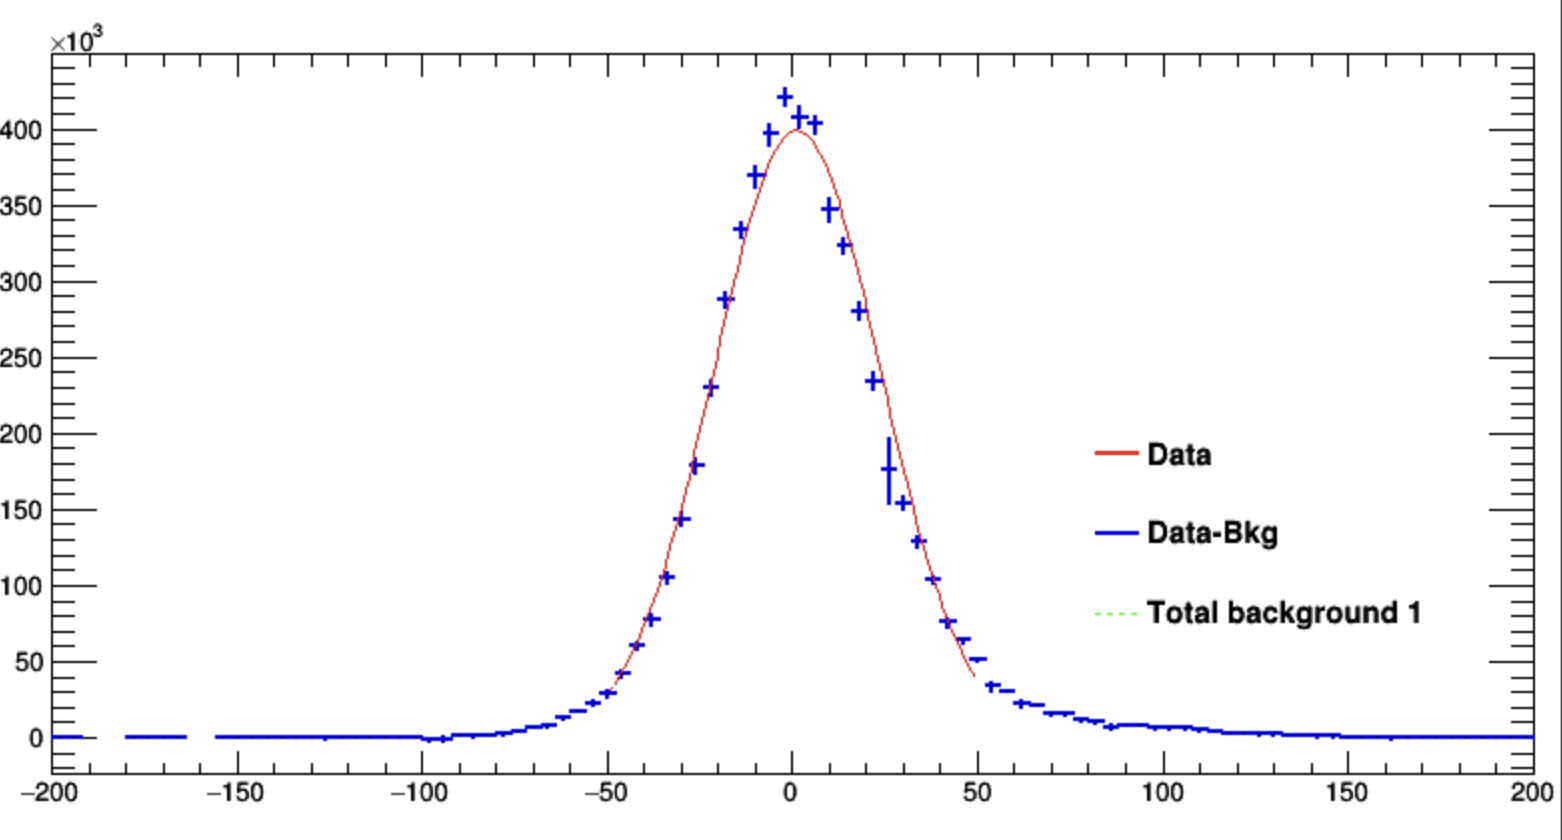
# Fit data-bkg distribution with a Gaussian (blue)
hist_data_minus_bkg = hist_data_minus_bkg.Clone()
fit_data_minus_bkg = hist_data_minus_bkg.Fit("gaus", "S", "", -50, 50)
#
hist_data_minus_bkg.SetLineColor(ROOT.kBlue)
hist_data_minus_bkg.SetLineWidth(2)
hist_data_minus_bkg.Draw("same")
then even if I do not plot the fitted function, it appears on canvas, whereas the data (red points in first plot) bit also bkg (green points in previous plot) disappear, ie only the data-bkg and the fit are drawn. Even if I try to redraw the other histograms, they still do not appear on the canvas
Thanks for posting. I think I miss some context to help out here: could you please post a minimal reproducer of the behaviour which I could also run? I am confident that once we have those few lines we can fix this.
Once you have done a fit on a histogram, the fitting function becomes an item in the list of functions of this histogram. When the histogram is drawn the list of functions is also drawn. If you want to draw only the histogram you need the option “HIST”:
{
   auto C = new TCanvas();
   auto h1 = new TH1D("h1","Background", 100,-1,1);
   auto h2 = new TH1D("h2","Data", 100,-1,1);
   h1->FillRandom("gaus",100000);
   h2->FillRandom("gaus",100000);
   h1->Draw("P");
   h2->Fit("gaus","","SAME");
}