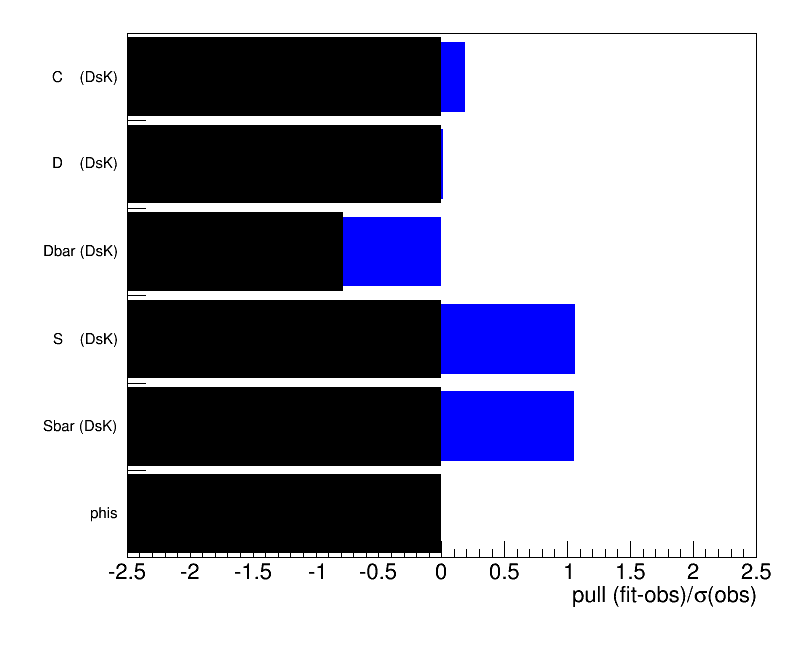
I used to make a pull graph, which visualized positive and negative pulls as horizontal bars that can be positive or negative. Since horizontal bar histograms only fill from the left axis to the value, I defined a second mask histogram, masking out the parts of the bars that I don’t want. That was filled white.
In recent root versions, this doesn’t work anymore, because the bars get filled black, not white! Any other fill color works fine, only white fails.
The workaround doesn’t fully fix the problem unfortunately, because in my production script (attachted)
i) there is still a weird black area in the right TPad, which I don’t even know how to configure the color of, and
ii) when the thing is saved as .C, “my own white” gets lost again.
Also, this plot is only this complicated because there is no way (that I know of) to configure alphanumeric labels for a TGaxis.
I now remember why we introduced this. This is not a bug. It was done on purpose to make sure the histograms are always visible. We had some complains that, sometimes, an histogram can be invisible because drawn white in a white pad. Now the way you are using histograms is a bit “at the edge” of a normal use as it is not real data. It is use as a rubber to erase part of the bins. Nevertheless I will check your script.
I do not see this in the original macro “pulls.C”… Should I debug the new one you last sent ?
This macro has been produced with “Save As”… May it it would be better to debug the original one.
do:
   Int_t ci = 12345;
   TColor *color = new TColor(ci, 1., 1., .9);
   hPullsMaskUID98->SetFillColor(ci);