Problem with Extended Models

Hi everyone,
I keep having this issue with normalization of extended likelihood fits (I am currently using pyRoot).
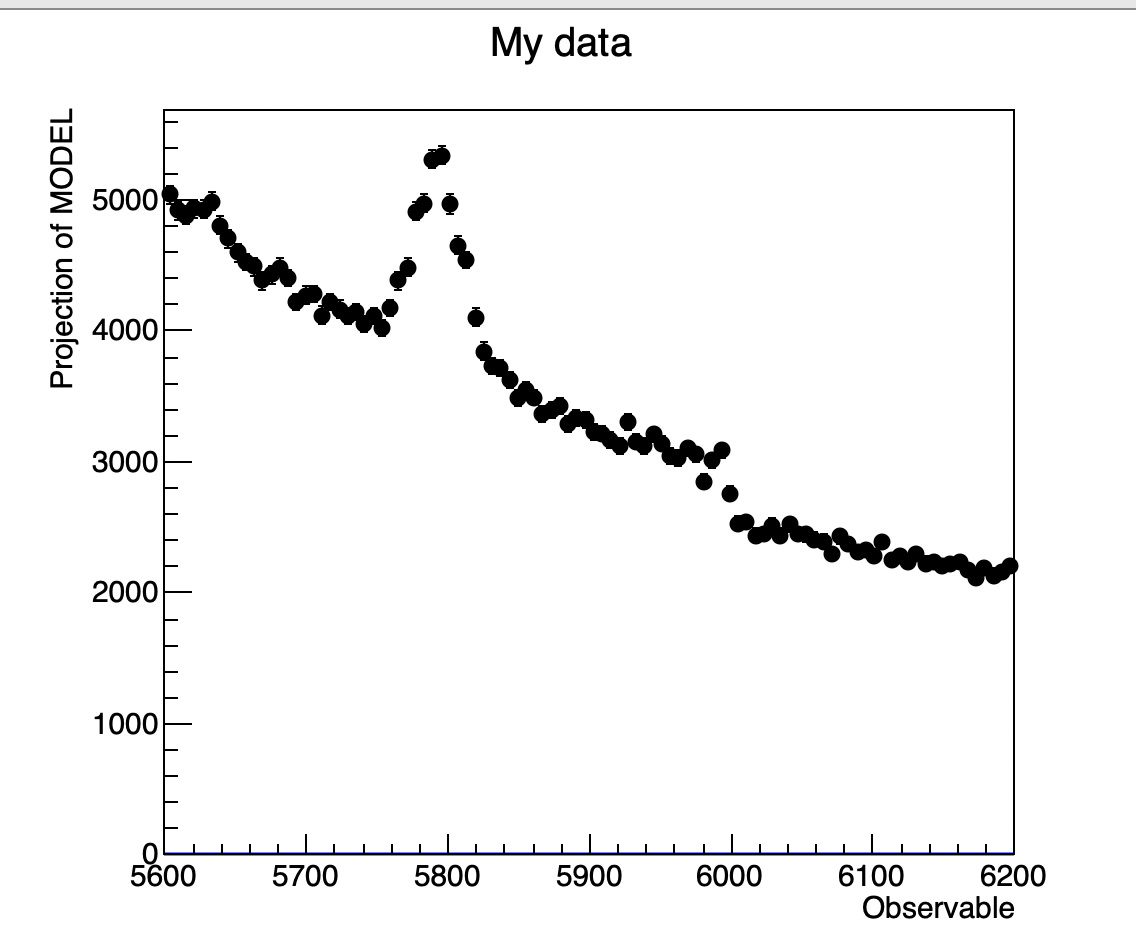
I am trying to fit binned data from a histogram with a composite model signal+background, but even if use RooExtendPdf when I plot model and dataset on the same canvas, the fit is normalized to 1 while data is obviously not.
I followed the user manual “Example 7” and double checked multiple times, but the problem won’t go away.
Here’s my code:

from ROOT import *

filename = TFile("../All_tmp.root")
tree = filename.Get("Xib0/mytree")
x = RooRealVar("lab0_M","Observable",5600,6200)
hist = TH1F("hist_name","hist title",100,5600,6200)

for event in tree:
    hist.Fill(tree.lab0_M)

data = RooDataHist("data","my dataset",x,hist)

mean = RooRealVar("mean","mass mean",5800,5900,6200)
width = RooRealVar("width","gaussian width", 130,10,500)
gauss = RooGaussian("gauss","gaussian pdf",x,mean,width)

par1 = RooRealVar("param1","bgparam1",0.,100.,1.)
par2 = RooRealVar("param2","bgparam2",0.,100.,1.)
ground=RooArgusBG("bkg","background p.d.f.",x,par1,par2)

nsig = RooRealVar("nsig","signal fraction",10000,0.,80000.)
nbkg = RooRealVar("nbkg","background fraction",10000,0.,80000.)
Egaus = RooExtendPdf("esig","esig",gauss,nsig)
Ebkg = RooExtendPdf("ebkg","ebkg",ground,nbkg)
model = RooAddPdf("model","MODEL", RooArgList(Egaus,Ebkg))

xframe = x.frame(RooFit.Title("My data"))
model.plotOn(xframe)
data.plotOn(xframe)
model.fitTo(data)
xframe.Draw()

Can anyone help me?
Thanks a lot,
Andrea

@StephanH could you take a look, please?

Hi Andrea,

The ExtendPdf is more tricky to use than directly giving two coefficients to the AddPdf, see Method 1 in this tutorial:
https://root.cern.ch/doc/master/rf202__extendedmlfit_8py.html

If you move nsig, nbkg into

model = RooAddPdf("model","MODEL", RooArgList(gaus, ground), RooArgList(nsig, nbkg))

It will hopefully work as you expect.

Hi Stephan,
unfortunately, it does not work. I had already tried that one.
I also tried to change background type but I always get the same result. (I am working with Python 3.8, Root 6-22 and RooFit 3.60)

I attach my result: see how the blue line is down near the x axis, but it should be at least of the same order of magnitude as the black dotted line.

Is there anything else I can do?

Thanks in advance,
Andrea

Hi Andrea,

what are the statistics of the RooDataHist, especially Print("V"), numEntries(), sumEntries()?

Oh, wait. It’s easy if you know what to look for:

So you do (remember the order in which you plot & fit!):

And now read the first two items of the plotOn() documentation. I guess reordering will solve it.

1 Like

Thanks!
( for any future readers: I just had to swap model.plotOn() and data.plotOn())
I cannot believe such a stupid mistake made me waste so much time… :astonished:
Stephan, you’re an absolute legend!
Cheers

Andrea

:+1:

Wow, thanks!

This topic was automatically closed 14 days after the last reply. New replies are no longer allowed.