Problem with drawing multigraph

Dear ROOTers,
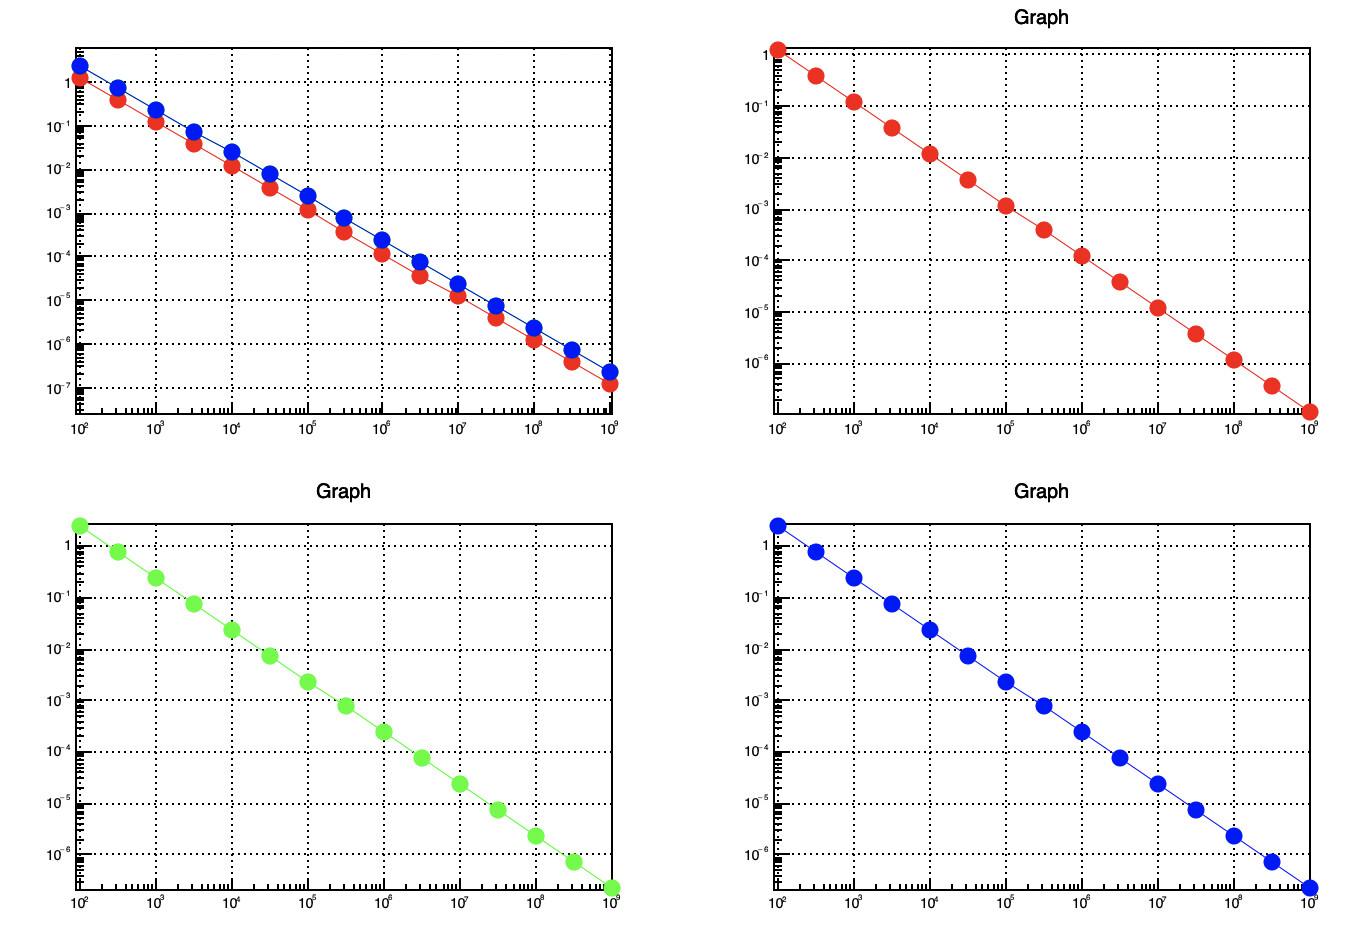
I’m not sure if this is a bug or I’m doing something wrong but I cannot draw MultiGraph correctly - whereas single graphs are working fine. The code looks like this:

double data[96] = {
  100,         1.18958,     316,         0.376449,    1000,        0.118958,    3162,        0.0376211,   10000,
  0.0118958,   31622,       0.00376187,  100000,      0.00118958,  316227,      0.000376179, 1000000,     0.000118958,
  3162277,     3.76178e-05, 10000000,    1.18958e-05, 31622776,    3.76178e-06, 100000000,   1.18958e-06, 316227766,
  3.76178e-07, 1000000000,  1.18958e-07, 100,         2.37916,     316,         0.752898,    1000,        0.237916,
  3162,        0.0752422,   10000,       0.0237916,   31622,       0.00752374,  100000,      0.00237916,  316227,
  0.000752357, 1000000,     0.000237916, 3162277,     7.52356e-05, 10000000,    2.37916e-05, 31622776,    7.52356e-06,
  100000000,   2.37916e-06, 316227766,   7.52356e-07, 1000000000,  2.37916e-07, 100,         2.37916,     316,
  0.752898,    1000,        0.237916,    3162,        0.0752422,   10000,       0.0237916,   31622,       0.00752374,
  100000,      0.00237916,  316227,      0.000752357, 1000000,     0.000237916, 3162277,     7.52356e-05, 10000000,
  2.37916e-05, 31622776,    7.52356e-06, 100000000,   2.37916e-06, 316227766,   7.52356e-07, 1000000000,  2.37916e-07};

void demo()
{
  TMultiGraph* m = new TMultiGraph();
  TGraph** gr    = new TGraph*[3];
  Color_t col[3] = {kRed, kGreen, kBlue};
  Int_t count    = 0;
  for (int i = 0; i < 3; i++) {
    gr[i] = new TGraph(15);
    gr[i]->SetLineColor(col[i]);
    gr[i]->SetMarkerColor(col[i]);
    gr[i]->SetMarkerStyle(kFullCircle);
    cout << "iiiii " << endl;
    for (int j = 0; j < 15; j++) {
      gr[i]->SetPoint(j, data[count], data[count + 1]);
      cout << j << " " << data[count] << " " << data[count + 1] << endl;
      count += 2;
    }
    m->Add(gr[i], "LP");
  }


  TCanvas* c = new TCanvas();
  c->Divide(2, 2);
  c->cd(1);
  m->Draw("ALP");
  m->GetXaxis()->SetRangeUser(100, 1E+9);
  gPad->Modified();
  gPad->Update();
  gPad->SetLogx();
  gPad->SetLogy();
  gPad->SetGridx();
  gPad->SetGridy();
  for (int i = 0; i < 3; i++) {
    c->cd(i + 2);
    TGraph* gr2 = (TGraph*) gr[i]->Clone();
    gr2->Draw("ALP");
    gr2->GetXaxis()->SetRangeUser(100, 1E+9);
    gPad->SetLogx();
    gPad->SetLogy();
    gPad->SetGridx();
    gPad->SetGridy();
  }
}

The problem is than log scale on Y doesn’t work, also the X-axis range is not set correctly.


Please read tips for efficient and successful posting and posting code

ROOT Version: 6.16/00
Platform: Not Provided
Compiler: Not Provided


This version is fine:

double data[96] = {
  100,         1.18958,     316,         0.376449,    1000,        0.118958,    3162,        0.0376211,   10000,
  0.0118958,   31622,       0.00376187,  100000,      0.00118958,  316227,      0.000376179, 1000000,     0.000118958,
  3162277,     3.76178e-05, 10000000,    1.18958e-05, 31622776,    3.76178e-06, 100000000,   1.18958e-06, 316227766,
  3.76178e-07, 1000000000,  1.18958e-07, 100,         2.37916,     316,         0.752898,    1000,        0.237916,
  3162,        0.0752422,   10000,       0.0237916,   31622,       0.00752374,  100000,      0.00237916,  316227,
  0.000752357, 1000000,     0.000237916, 3162277,     7.52356e-05, 10000000,    2.37916e-05, 31622776,    7.52356e-06,
  100000000,   2.37916e-06, 316227766,   7.52356e-07, 1000000000,  2.37916e-07, 100,         2.37916,     316,
  0.752898,    1000,        0.237916,    3162,        0.0752422,   10000,       0.0237916,   31622,       0.00752374,
  100000,      0.00237916,  316227,      0.000752357, 1000000,     0.000237916, 3162277,     7.52356e-05, 10000000,
  2.37916e-05, 31622776,    7.52356e-06, 100000000,   2.37916e-06, 316227766,   7.52356e-07, 1000000000,  2.37916e-07};

void demo()
{
  TMultiGraph* m = new TMultiGraph();
  TGraph** gr    = new TGraph*[3];
  Color_t col[3] = {kRed, kGreen, kBlue};
  Int_t count    = 0;
  for (int i = 0; i < 3; i++) {
    gr[i] = new TGraph(15);
    gr[i]->SetLineColor(col[i]);
    gr[i]->SetMarkerColor(col[i]);
    gr[i]->SetMarkerStyle(kFullCircle);
    cout << "iiiii " << endl;
    for (int j = 0; j < 15; j++) {
      gr[i]->SetPoint(j, data[count], data[count + 1]);
      cout << j << " " << data[count] << " " << data[count + 1] << endl;
      count += 2;
    }
    m->Add(gr[i], "LP");
  }


   TCanvas* c = new TCanvas();
   c->Divide(2, 2);
   c->cd(1);
   m->Draw("ALP");

   gPad->SetLogx();
   gPad->SetLogy();
   gPad->SetGridx();
   gPad->SetGridy();
   m->GetXaxis()->SetRangeUser(100, 1E+9);

   for (int i = 0; i < 3; i++) {
      c->cd(i + 2);
      TGraph* gr2 = (TGraph*) gr[i]->Clone();
      gr2->Draw("ALP");
      gr2->GetXaxis()->SetRangeUser(100, 1E+9);
      gPad->SetLogx();
      gPad->SetLogy();
      gPad->SetGridx();
      gPad->SetGridy();
   }
}

This topic was automatically closed 14 days after the last reply. New replies are no longer allowed.