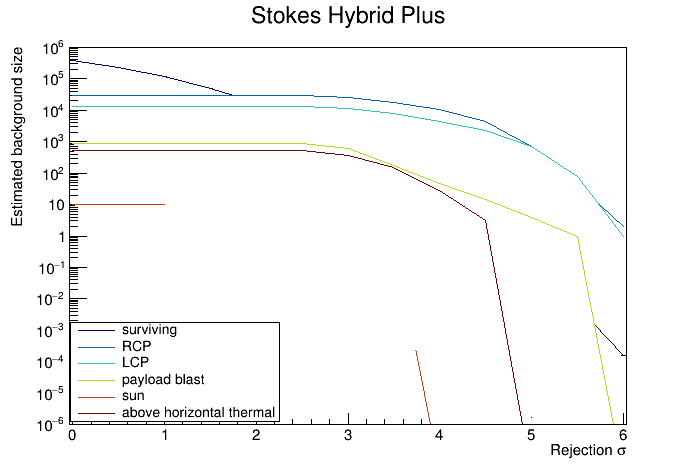
I’m not sure if this is a bug or not, but when I run the attached macro, it looks when lines are overlaid on log scale they aren’t drawn completely or there is some sort of background associated with each graph which obscures them. When I don’t draw the graphs on log scale, it looks like the lines are drawn properly, but I could be wrong.
The way I draw these lines in the macro is to use TMultiGraph, the draw with option “A L PLC”. Should I set some sort of other option? I include “goff”, but that’s just to avoid drawing canvases at run time.
“goff” is not a drawing option for graphs (see TGraphPainter), but “f” is (meaning “fill”), and ROOT simply ignores the “g” and “o”. If you draw with “f” instead of “goff” you will probably see the same that you are getting now.
If you don’t want to see the canvases while the macro runs, you can run it in batch mode without graphics, either from the command line (e.g. root -l -b -q mymacro.C) or add gROOT->SetBatch(kTRUE); inside the macro.
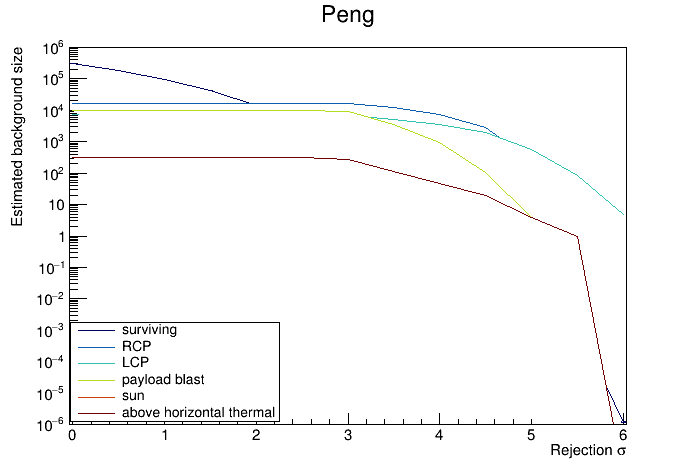
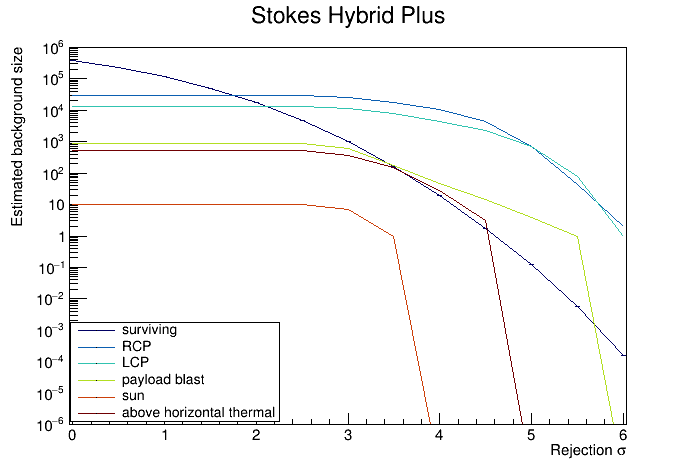
Indeed. It also won’t run properly without some of the binaries the TChains reference as well. I hadn’t thought to include those as I was thinking my problem was a syntactic one which could be pointed out after looking through the script. Fortunately, @dastudillo found the error and now the script produces expected output.