abaf
June 5, 2021, 11:56am
1
Hi,
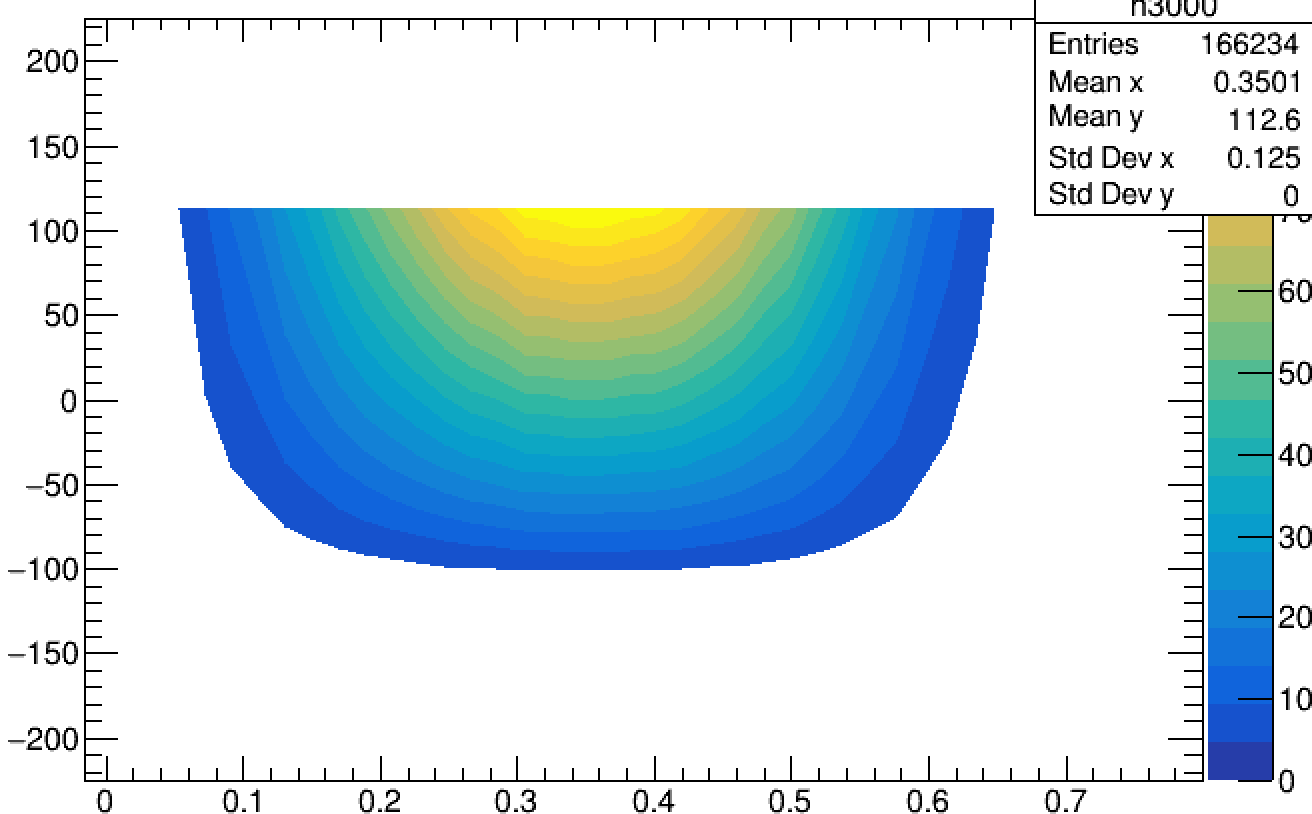
I am trying to Draw a scatter plot with CONT4Z option, however, it show I have negative entries even though the minimum is 0
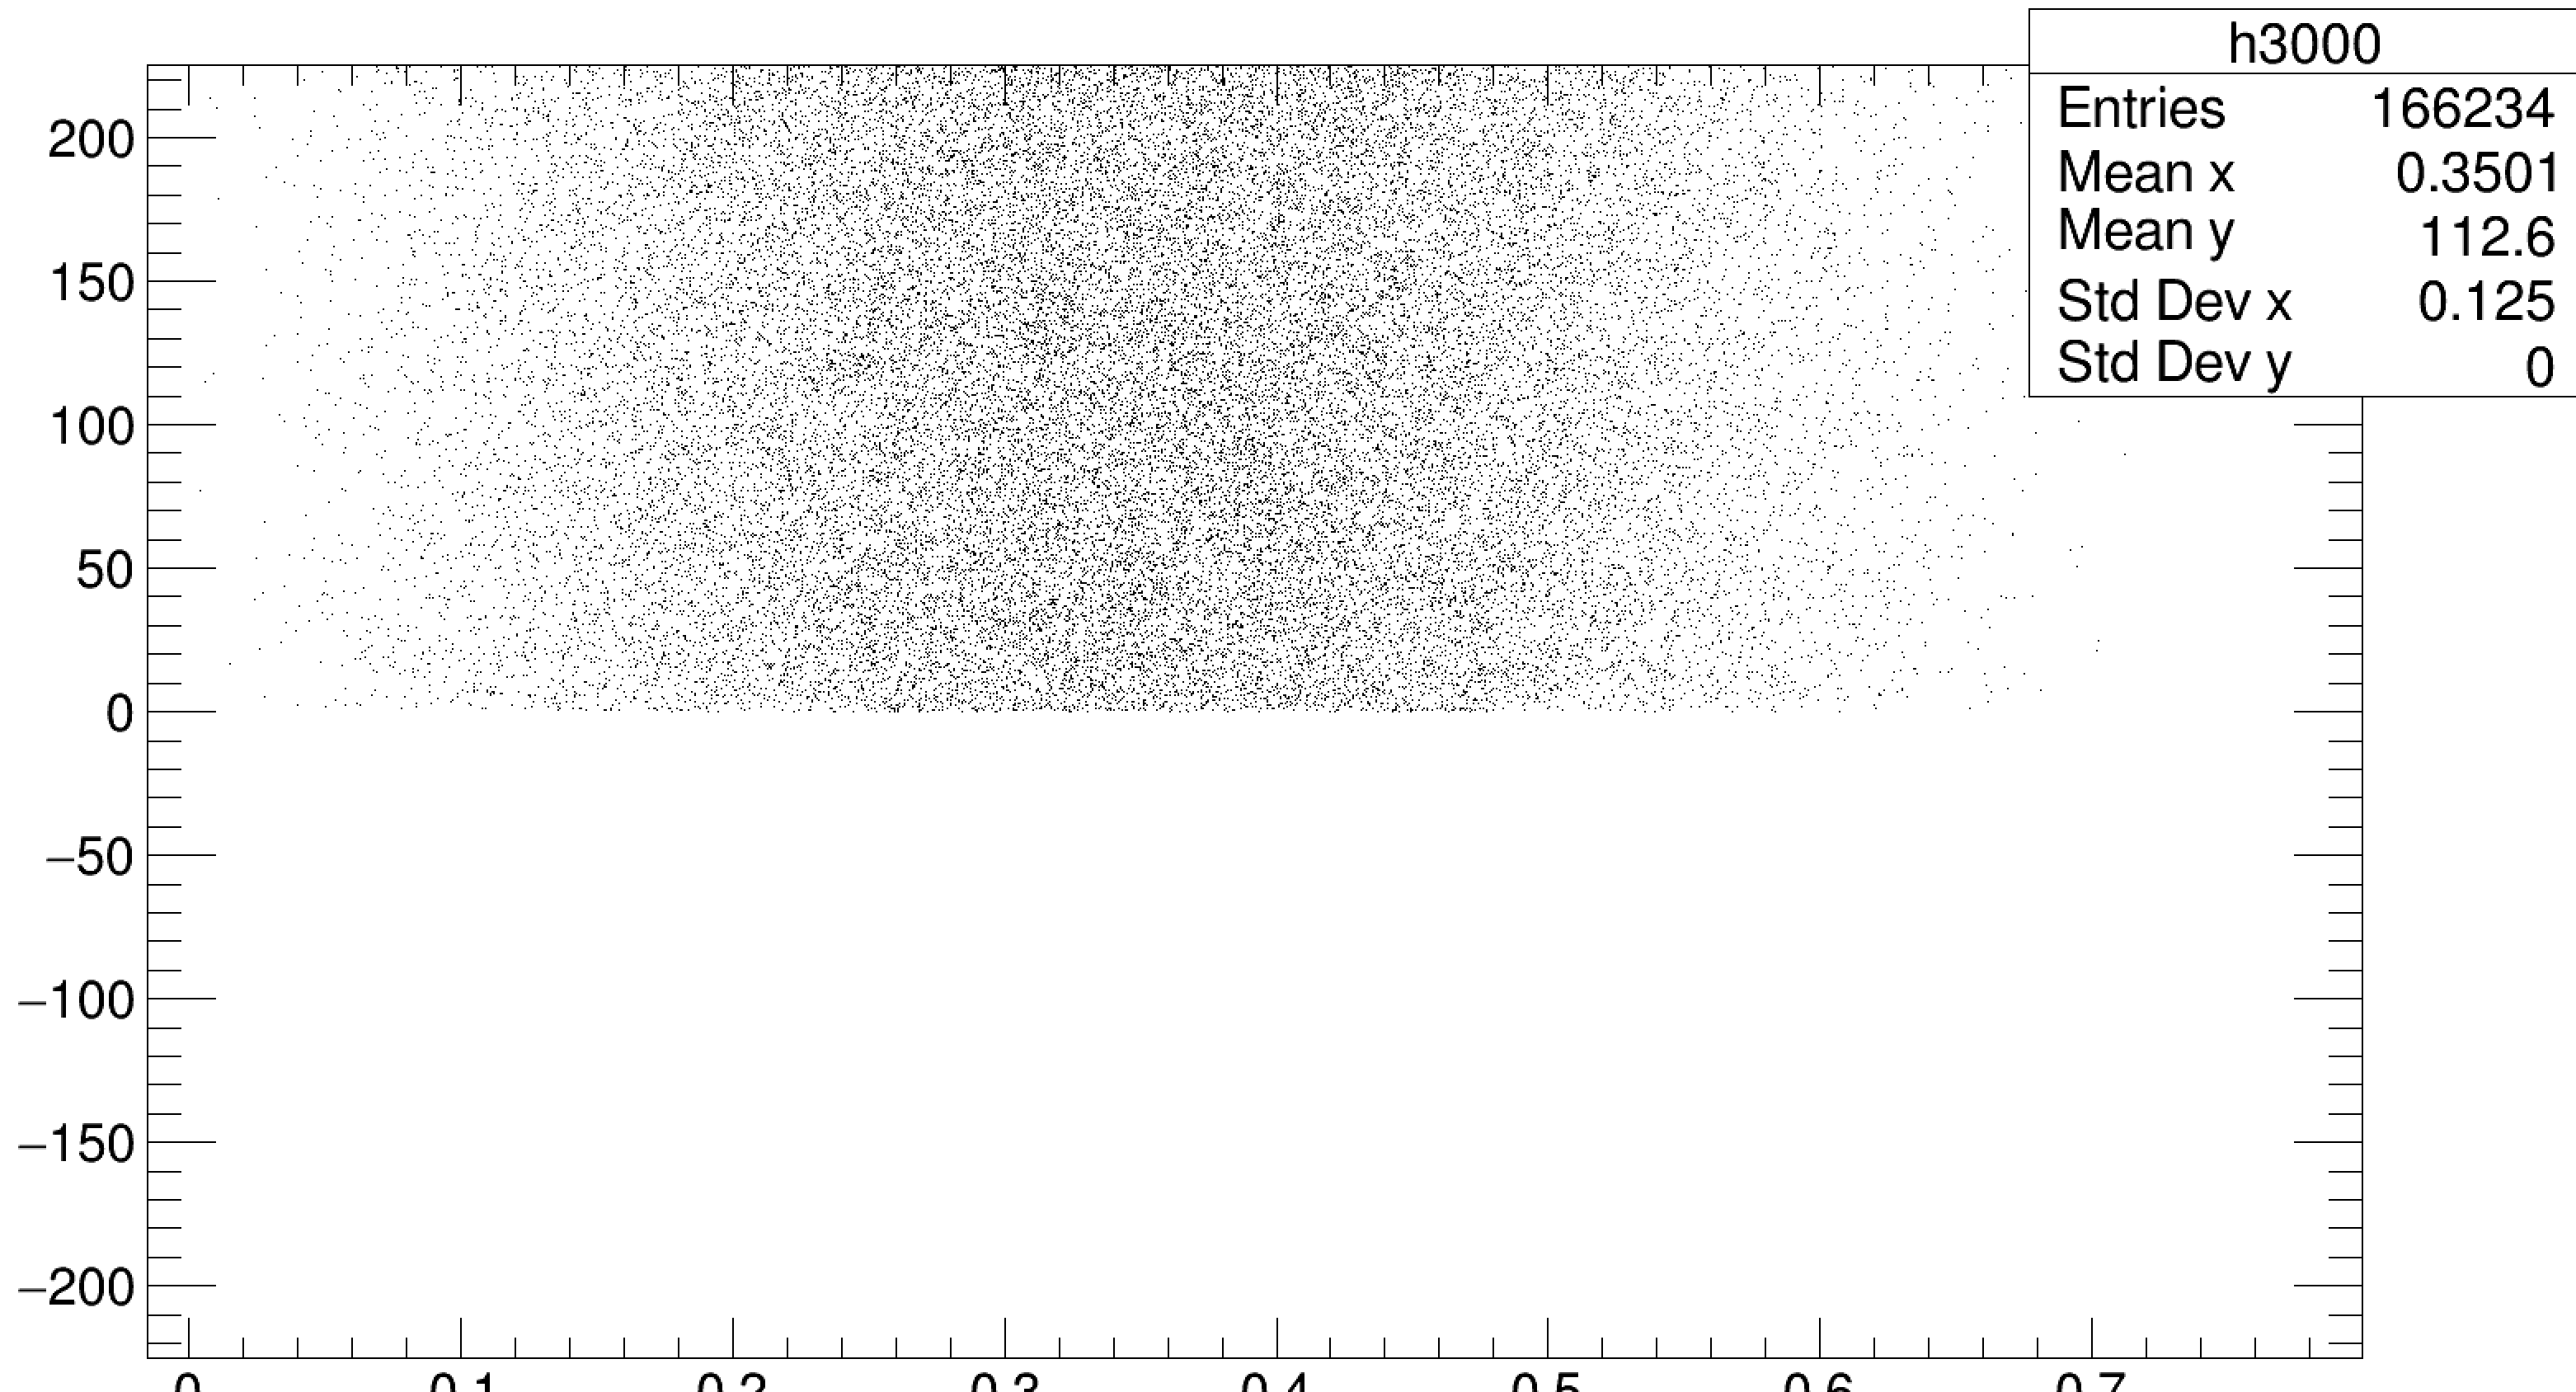
With the draw option “SCAT” I get only + values. Would like the same with the CONT draw option.
Help will be much appreciated!
Please read tips for efficient and successful posting and posting code
ROOT Version: 6.18/00Platform: MACCompiler: Not Provided
yus
June 5, 2021, 1:09pm
2
Hi,
I see the negative values only along the Y axis on your plot. And GetMinimum() will return the minimum along the Z axis in case of a TH2 - this is exactly what we see in your plot.
abaf
June 5, 2021, 1:13pm
3
Hi,
Thank you for the info! I plotted the same history with “SCAT” and I dont see negative values in the option… any ideas ?
Thank you.
yus
June 5, 2021, 1:18pm
4
Don’t really know. It’s also weird how your first histogram cuts off at Y=115, but the second one does not. Are you sure it’s the same histogram?
abaf
June 5, 2021, 1:21pm
5
Yes, just rechecked again and it is the same histogram.
yus
June 5, 2021, 1:24pm
6
Yeah, that’s rather strange. Is it a histogram from a .root file? If so, can you please share it here?
abaf
June 5, 2021, 1:27pm
7
Yes from a root file. Seems to be a bit too large to post here unfortunately !
yus
June 5, 2021, 1:37pm
8
I guess you could share it via your favorite file sharing service (Dropbox/Google drive/Mega/…).
couet
June 15, 2021, 7:55am
9
How does it look like with option COL ? with option LEGO ?