I have the problem with contours.
I have a datasheet with 6 variables: x,y,z,Bx,By,Bz
Now I want to plot a x-y Square and Bz as the contour at a special Z-Pos.
But i dont know how to set Bz as contour…
Here my Code:
#include "Riostream.h"
#include "TTree.h"
#include <fstream>
#include "TH3.h"
#include "TH2.h"
#include "TH1.h"
#include "TGraph2D.h"
#include "TStyle.h"


TH2F *Contour (const char * filename){

        Float_t x;
	Float_t y;
	Float_t z;
	Float_t Bx;
	Float_t By;
	Float_t Bz;
	Float_t zpos;
	Float_t ypos;
	Float_t xpos;

    TFile *file = new TFile(filename);
    TTree *tree = (TTree*)file->Get("Daten");
    tree->SetBranchAddress("x",&x);
    tree->SetBranchAddress("y",&y);
    tree->SetBranchAddress("z",&z);
    tree->SetBranchAddress("Bx",&Bx);
    tree->SetBranchAddress("By",&By);
    tree->SetBranchAddress("Bz",&Bz);

    Int_t nentries = tree->GetEntries();

    tree->Print();

    cout << endl << "Z-Position: ";
    cin >> zpos;

    TCanvas *c1 = new TCanvas("c1","Canvas", 0,0,700,600);
    TH2F * xyBz = new TH2F("xyBz","Bz over xy",100,-30.,35.,100,-30.,35.);


    for(int i=0; i < nentries; i++){
        tree->GetEntry(i);

        //Read Data for special Z-Pos and add in Hist
        if(z>= (zpos-1) && z<= (zpos+1)){
            cout << x << "  " << y << "  " << z << "  " << Bz << endl;
            xyBz->Fill(x,y,Bz);

        }
    }
    gStyle->SetPalette(1);
    xyBz->Draw("CONT4Z");
    xyBz->SetMinimum(0.03);
    xyBz->SetMaximum(0.04);


    return 0;
}
The graph looks like that:
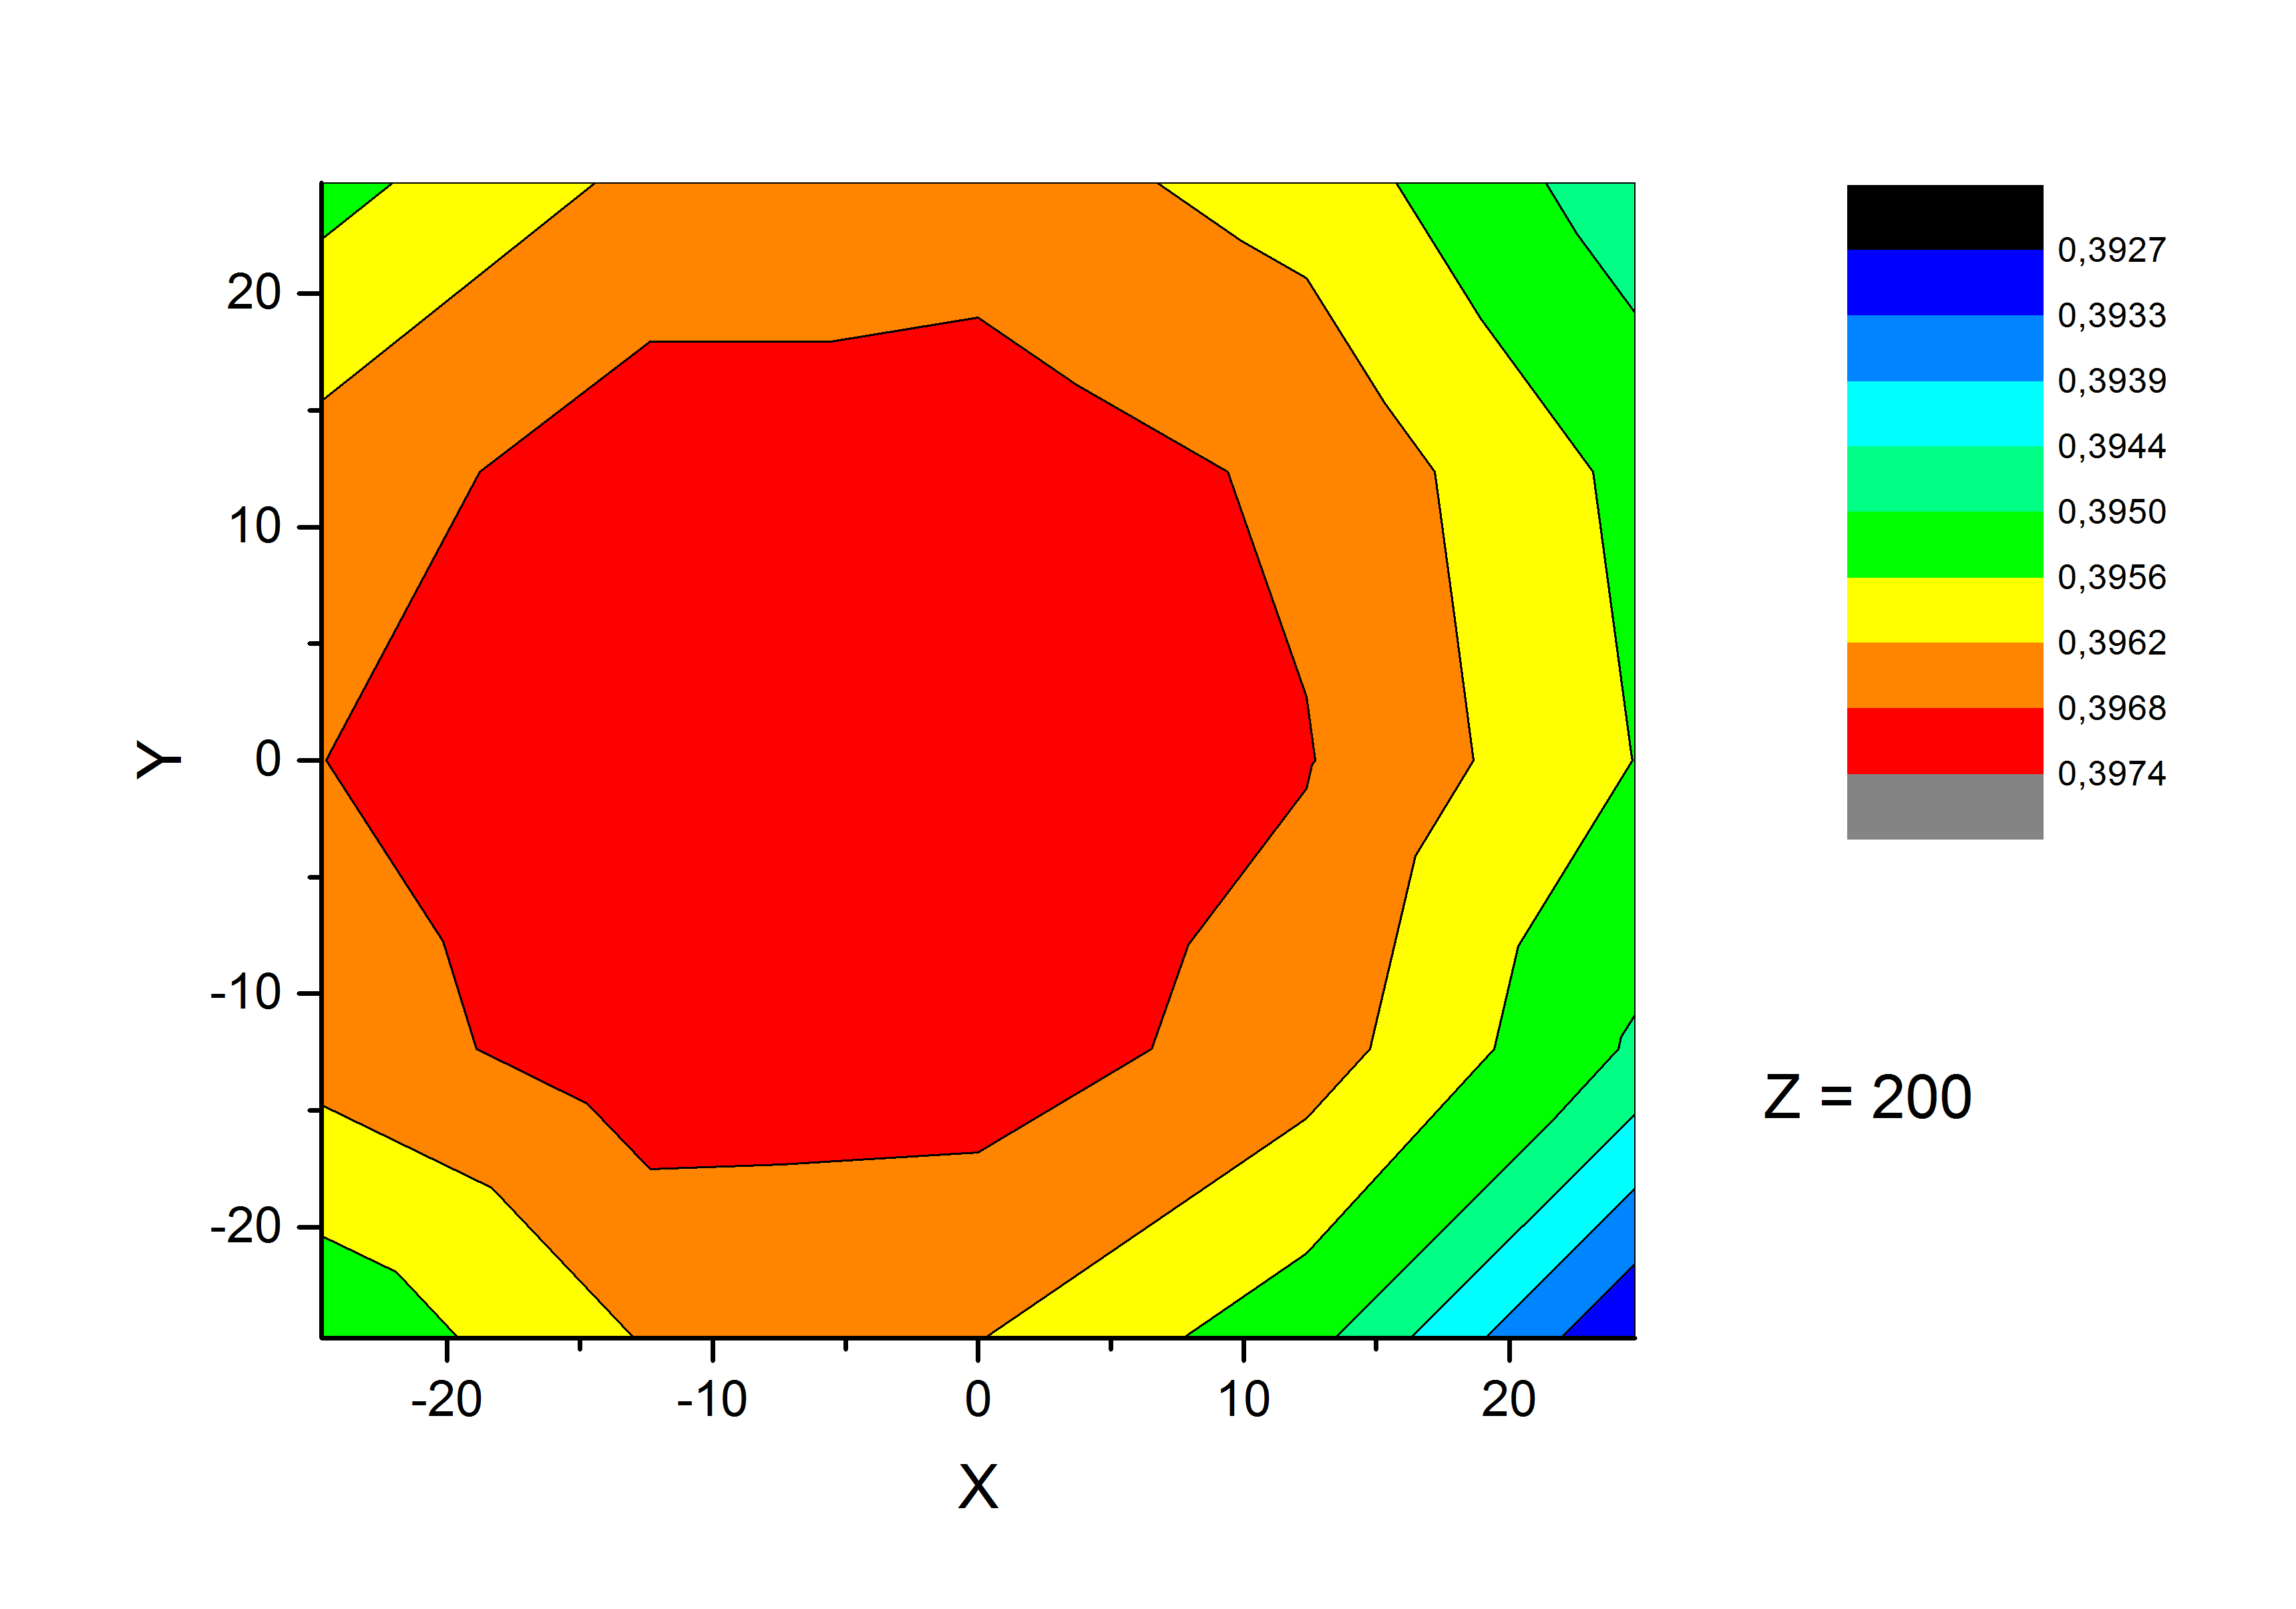
But I want it more like that, how I plotted the same Data for Z = 200 with ORIGIN
Hopefully you can help me.
data.root (9.75 KB)
Bz_over_xy.pdf (190 KB)