Hello everyone,
I am trying to plot a graph with certain y values with respect to their run numbers along the x-axis. Here is my code :
const Int_t n = 11;
Double_t run[n] = {1, 2, 3, 4, 5, 6, 7, 8, 9, 10, 11}; //run index that needs to be changed on the x-axis
/* Some code to compute my y values */
TCanvas *c1 = new TCanvas("c1", "c1", 700, 500);
c1->SetGrid();
TGraphErrors *gr = new TGraphErrors(n, run, ratio, 0, sig_ratio);
gr->GetXaxis()->ChangeLabel(1, -1, -1, -1, -1, -1, "0");
gr->GetXaxis()->ChangeLabel(2, -1, -1, -1, -1, -1, "1");
gr->GetXaxis()->ChangeLabel(3, -1, -1, -1, -1, -1, "2");
gr->GetXaxis()->ChangeLabel(4, -1, -1, -1, -1, -1, "139");
gr->GetXaxis()->ChangeLabel(5, -1, -1, -1, -1, -1, "140");
gr->GetXaxis()->ChangeLabel(6, -1, -1, -1, -1, -1, "141");
gr->GetXaxis()->ChangeLabel(7, -1, -1, -1, -1, -1, "142");
gr->GetXaxis()->ChangeLabel(8, -1, -1, -1, -1, -1, "144");
gr->GetXaxis()->ChangeLabel(9, -1, -1, -1, -1, -1, "147");
gr->GetXaxis()->ChangeLabel(10, -1, -1, -1, -1, -1, "149");
gr->GetXaxis()->ChangeLabel(11, -1, -1, -1, -1, -1, "150");
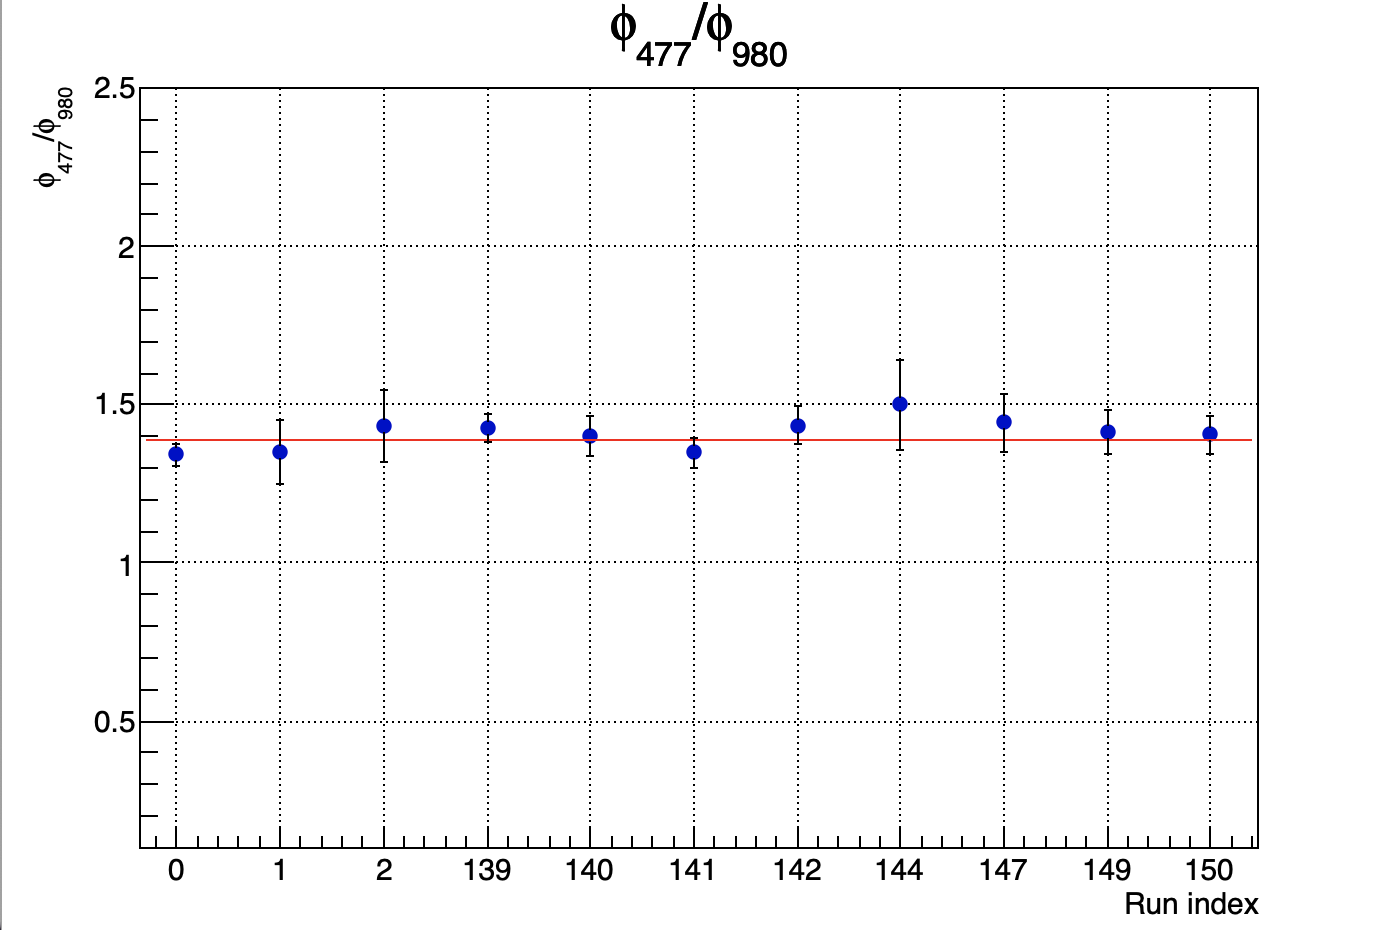
gr->SetTitle("#phi_{477}/#phi_{980}");
gr->GetXaxis()->SetLimits(0.65, 11.45);
gr->SetMinimum(0.1);
gr->SetMaximum(2.5);
gr->GetXaxis()->SetTitle("Run index");
gr->GetYaxis()->SetTitle("#phi_{477}/#phi_{980}");
gr->SetMarkerStyle(20);
gr->SetMarkerColor(kBlue+1);
gr->SetMarkerSize(0.9);
gr->Fit("fun_fit");
gr->Draw("AP");
As you can see I have different labels for my 11 runs going from 0 to 150. Using this type of code worked for me before but now it just won’t make it as shown in the next picture.
c1.pdf (14.4 KB)
Do you have any idea what’s wrong ?