Please provide the following information:
ROOT Version (e.g. 6.12/02):
Platform, compiler (e.g. MacOSX 10.12.6, gcc4):
Hi all,
I have data on a TTree, which contains different Branches, like, Charge, MaxAmp, distance, etc, etc, for a number of channels I have. For example, for each event given if I have 4 channels, I will store:
IntOffset00, IntOffset01, IntOffset02, IntOffset03,
MaxAmp00, MaxAmp01, MaxAmp02, MaxAmp03, etc
each one of this is already a branch saved by the main().
TCanvas *cCorrelation = new TCanvas("Correlation","Correlation",1200,1200);
  cCorrelation->Divide(2,2);
  TH2F *corrTH2F[4];
  for (Int_t i=0 ; i<nCh ; i++) {
      corrTH2F[i] = new TH2F(Form("Max Amplitude vs. non-noisy Charge in Ch%02d",i),"; Integrated Charge [A.U] ; Amplitud [V]",128,-10,70,128,-0.1,1.00);
      cCorrelation->cd(i+1);
      tSiPM->Draw(Form("MaxAmp%02d:IntOffset%02d>>corrTH2F[%i]",i,i,i),"","COLZ");
  }
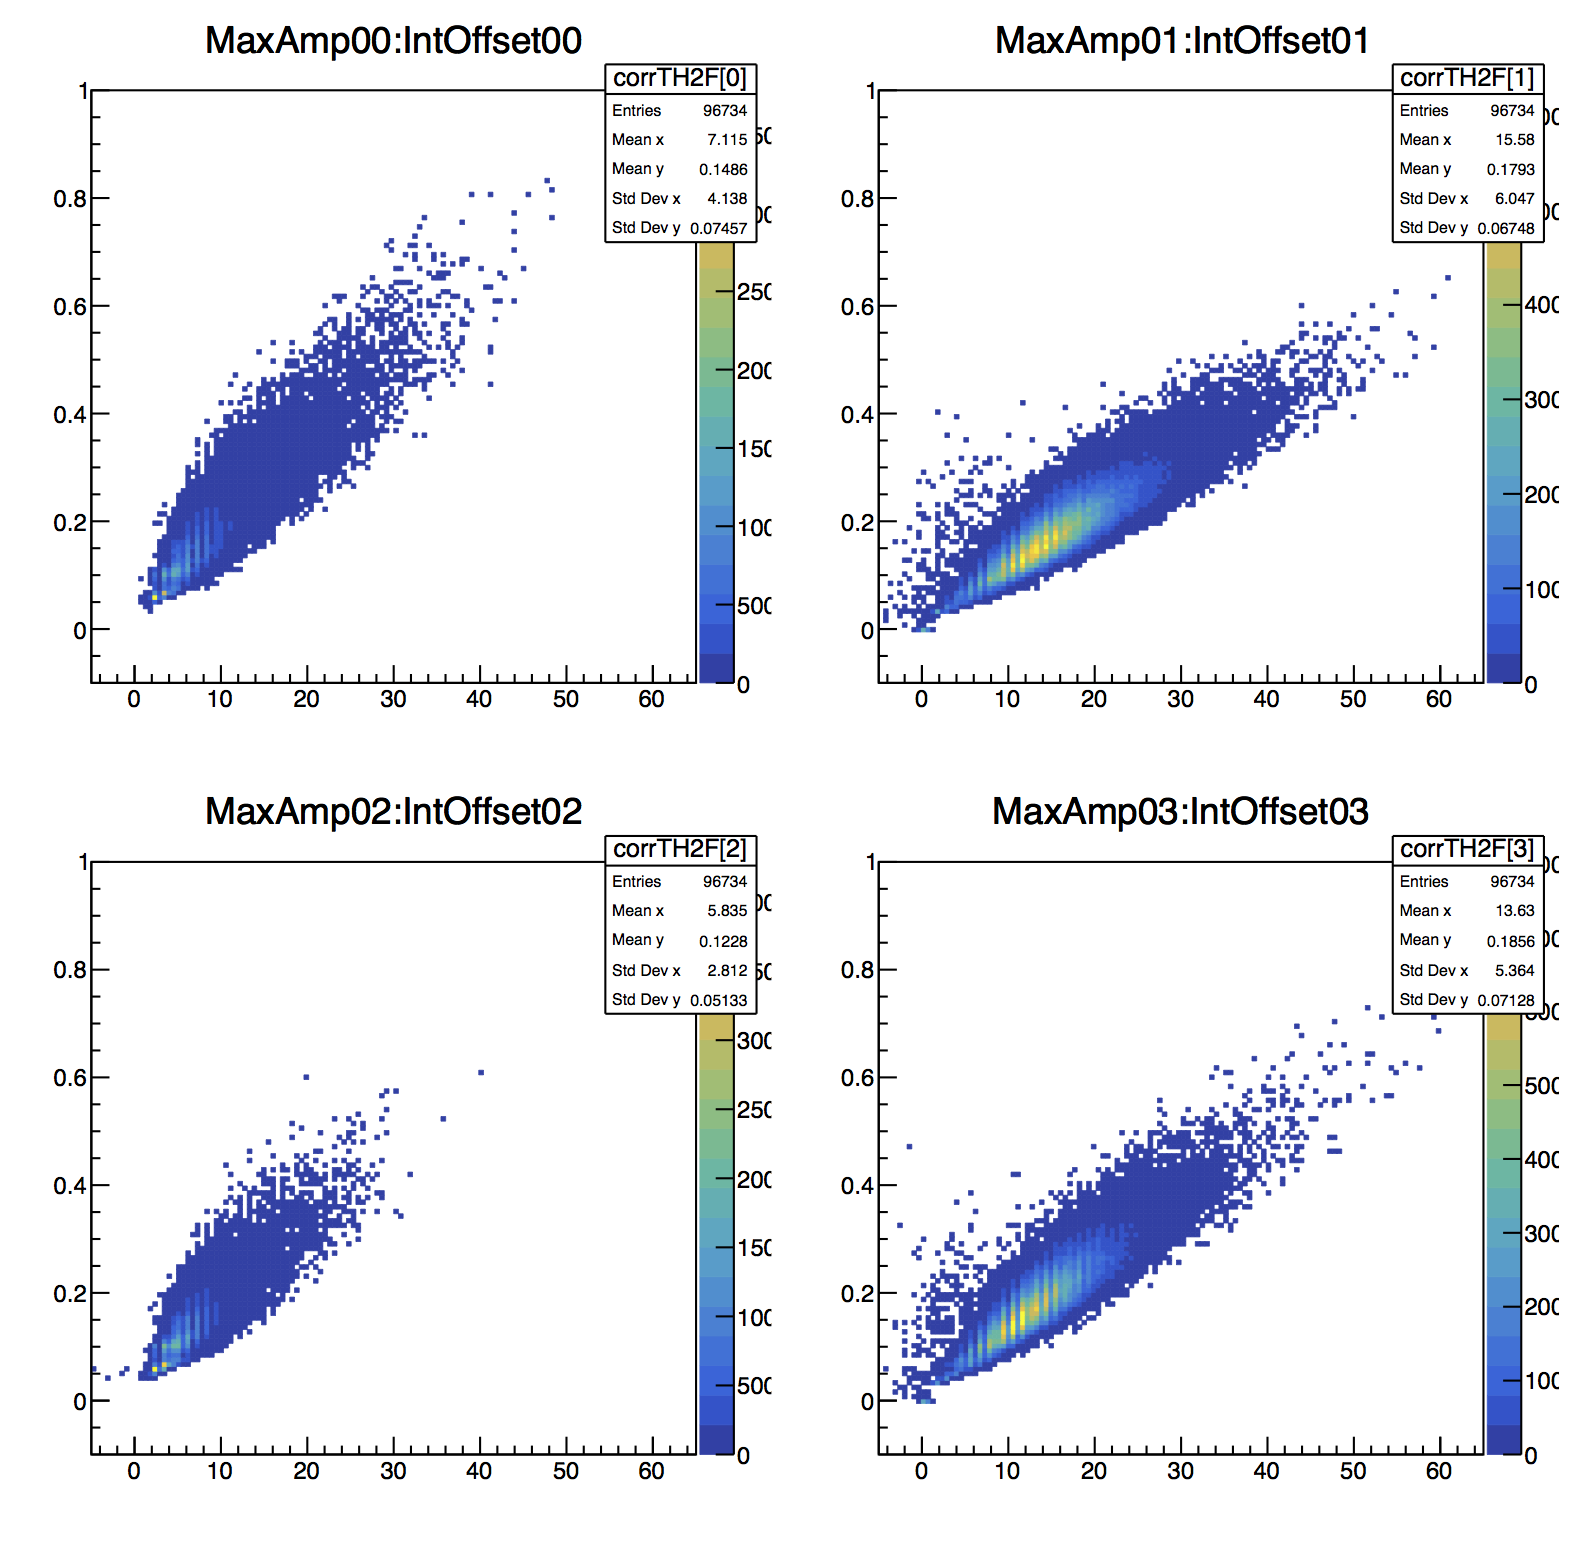
As you can see, I defined a TH2F array called corrTH2F[i], in which I will store my correlation histograms which are defined in the loop. Then I use the TTree:Draw() and the Form() method to draw my histograms. I expected that my histograms where store in the corrTH2F[i] elementes but apparently what it does is actually creating new 2D histograms named corrTH2F[%i], so the corrTH2F[i] and there properties are omited (axis labels, axis ranges, names, etc, etc), see attached figure.
How could I avoid this problem?
Thank you in advance for any possible suggestion.
Best regards,
David
Then what I wanted to do is to plot the correlation of this branches, for example, in this manner:
