Dear root’ers
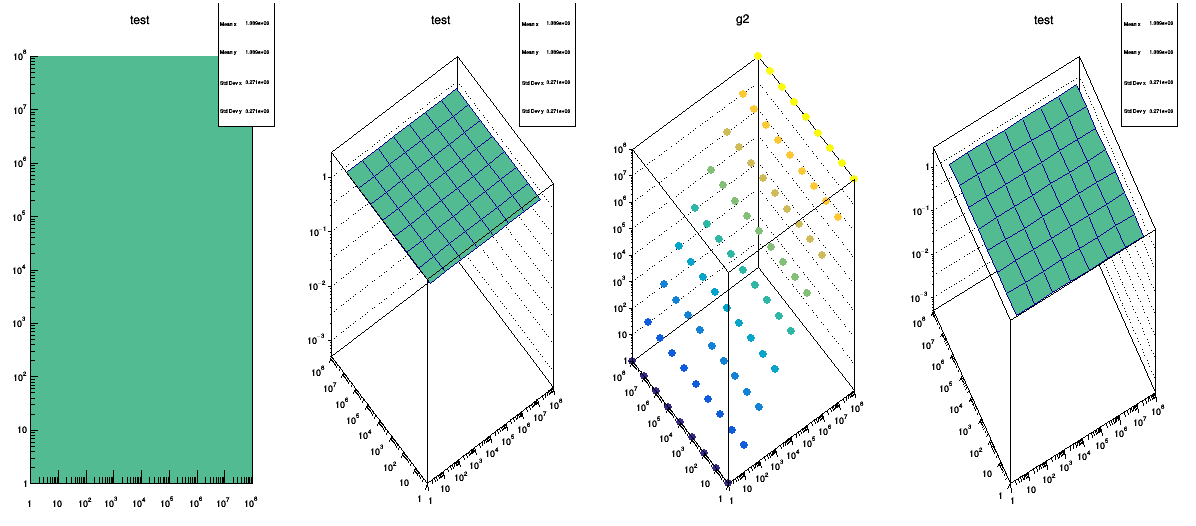
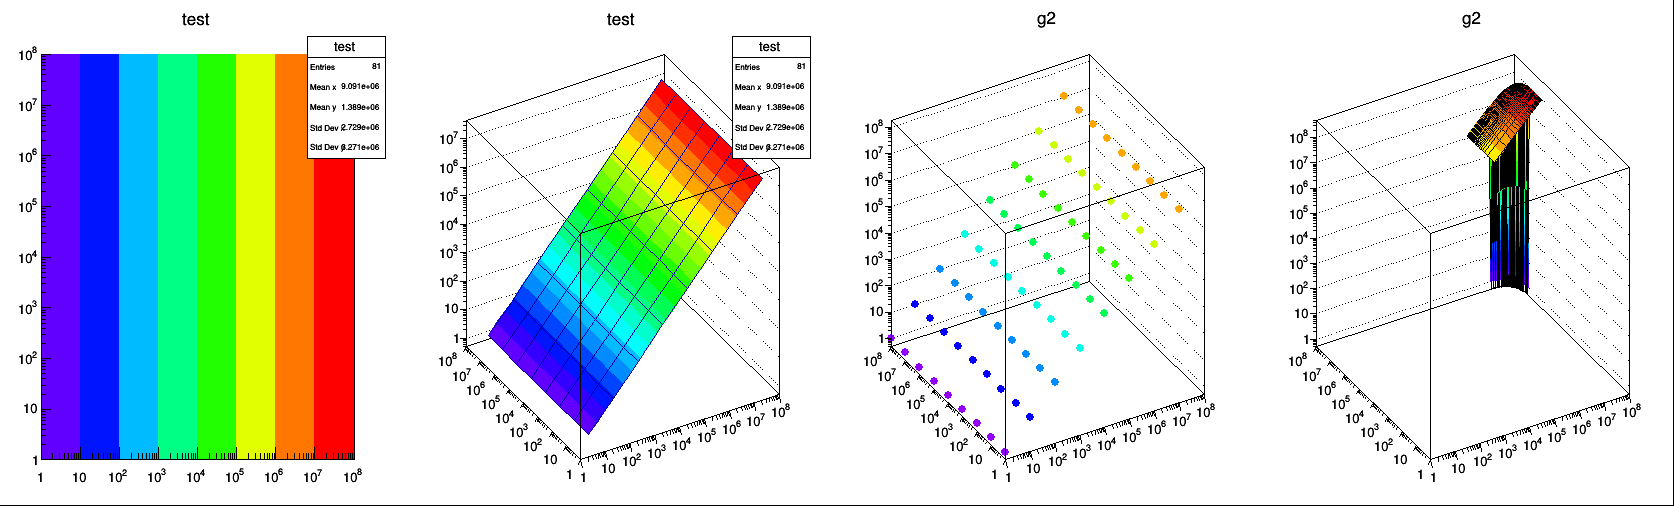
I’ve been having some issues potting 2d graphs with log axis on x, y and z. If I plot the data as a ‘COLZ’ I can see the entire scale with all my data available. However, if I plot the same data with the ‘SURF1’ option a significant part of my data is missing from the graphs!?
Is there a reason for this and can I find a ‘work around’ its super frustrating right now. Here is the snippet of code for the drawing:
It seems to me that the problem is that the “SURFace” drawing option paints the plot between the middles / centres of bins (and so the areas between the low-edge of the first bin and its middle / centre and then between the middle / centre of the last bin and its upper-edge are left “blank”).
The “COLor” drawing option paints entire / whole bins.
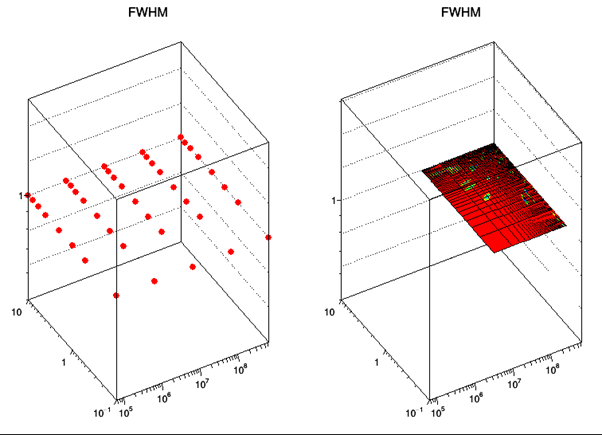
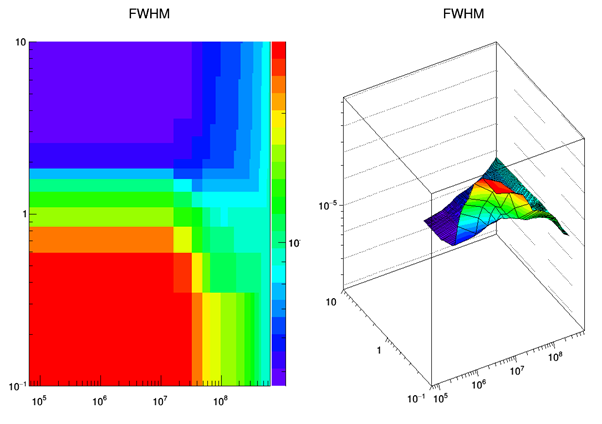
Thanks for the quick reply, I did a quick check to see if the binning is the problem here… but it doesn’t appear to be the case. The plot to the left is the “PCOL” option and the right the “surf” option. Its pretty clear that the graph to the right is missing data points . Any suggestions?
I changed the fill part of the code to
for(…){
h2->Fill(x,y,1.0)
}
Thanks in advance
StuPid1
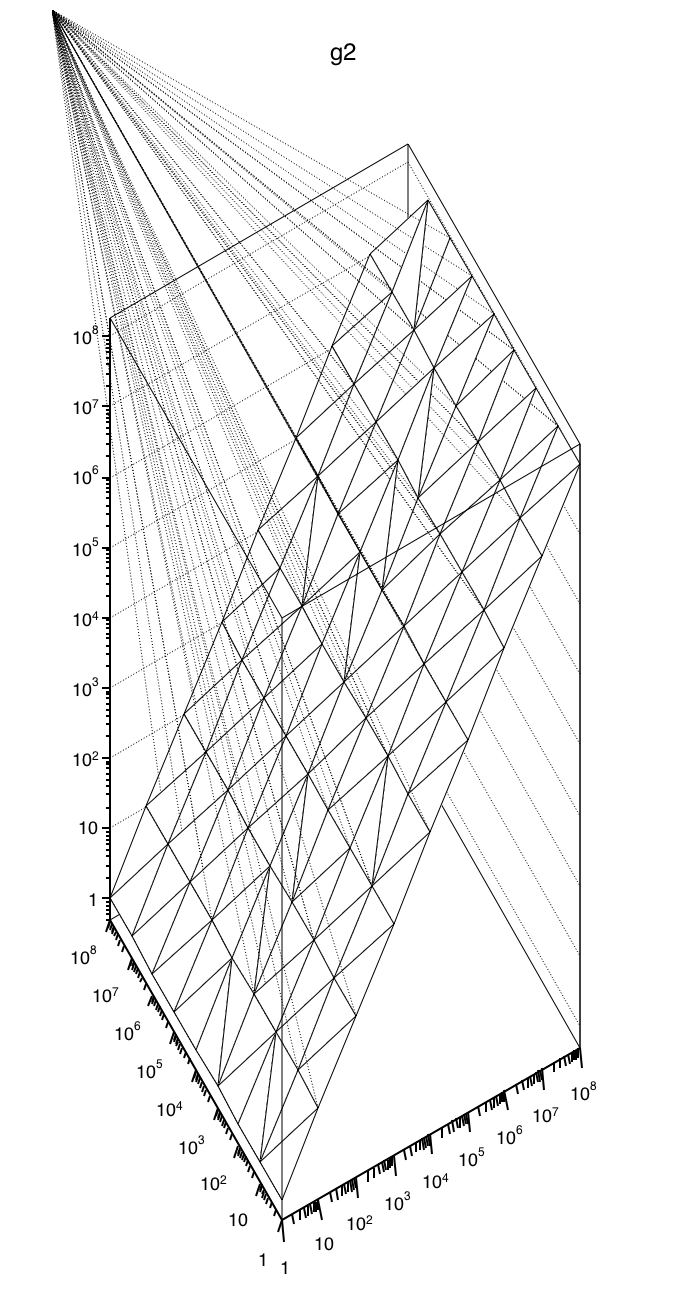
The SURF option used on a TGraph2D makes an interpolation via the Delaunay triangulation to fill a 2D histogram. It seems in that case the triangulation gets lost . If you plot the TGraph2D with the option TRI, showing the triangles used, you will get the following plot. It seems there is something wrong with the data.
Thanks for the information, i did the same “tri” option and i get the same as you. However, if you plot both tri on one canvas and the ‘SURF’ on the other you get the mess that i have in a prior comment.
thanks for that though, i can at least us it to validate the rest of my data.
Yes you can inspect your data using the TRI option. The triangles shown will be those used to fill the underlying histogram. Note also that a TGraph2D assumes that for one (x,y) pair there is only one z value. I also tried to plot your TGraph2D without the log option sand I also get a messed up plot.
Hi,
I am afraid this is an issue with the TRI algorithm when
points happen to fall on straight lines in some direction
of the surface.
This can be shown if one moves the Z-values a bit
Z[itt] = TMath::Power(10,i);
// shake it a bit
Z[itt] += 0.001 * (gRandom->Rndm() - .5);
 . Any suggestions?