Hi!
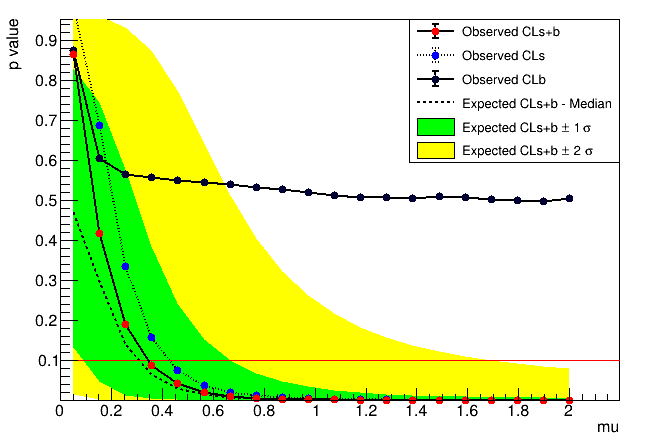
I have a very simple question about 2 sigma band of expected upper limit which is calculated by RooStats. In which case, the value of -2sigma tend to zero as is presented in figure i. e. how can I understand the value of -2sigma is zero?
Another question is that can someone explain a little bit concrete how the sensitity bands are calculated?
Thanks in advance.