faca87
February 4, 2021, 2:20pm
1
Hello, I’m using an old macro that I used to fit data from file, to just plot data.
Moreover, I would add tow coordinates line as in this graphdata2.txt (801 Bytes)RC.cpp (1.5 KB)
Please read tips for efficient and successful posting and posting code
ROOT Version: Not ProvidedPlatform: Not ProvidedCompiler: Not Provided
couet
February 4, 2021, 2:34pm
2
void RC() {
const char *datain = "data2.txt";
const char *dataout = "RC.pdf";
TCanvas *c01 = new TCanvas("c01","Graph",1280,1024);
float offx=1.3;
float offy=1.3;
float margr=0.08;
float w=3;
float margl=0.12;
float line=2;
gPad->SetLeftMargin(margl);
gPad->SetRightMargin(margr);
TGraph *graph = new TGraph(datain,"%lg %lg");
graph->SetMarkerColor(kBlue);
graph->SetLineColor(kBlue);
graph->SetMarkerStyle(3);
graph->SetMarkerSize(1.3);
graph->SetLineWidth(line);
TPaveText *t=new TPaveText(0.7,0.15,0.75,0.2,"brNDC");
graph->Draw("ap");
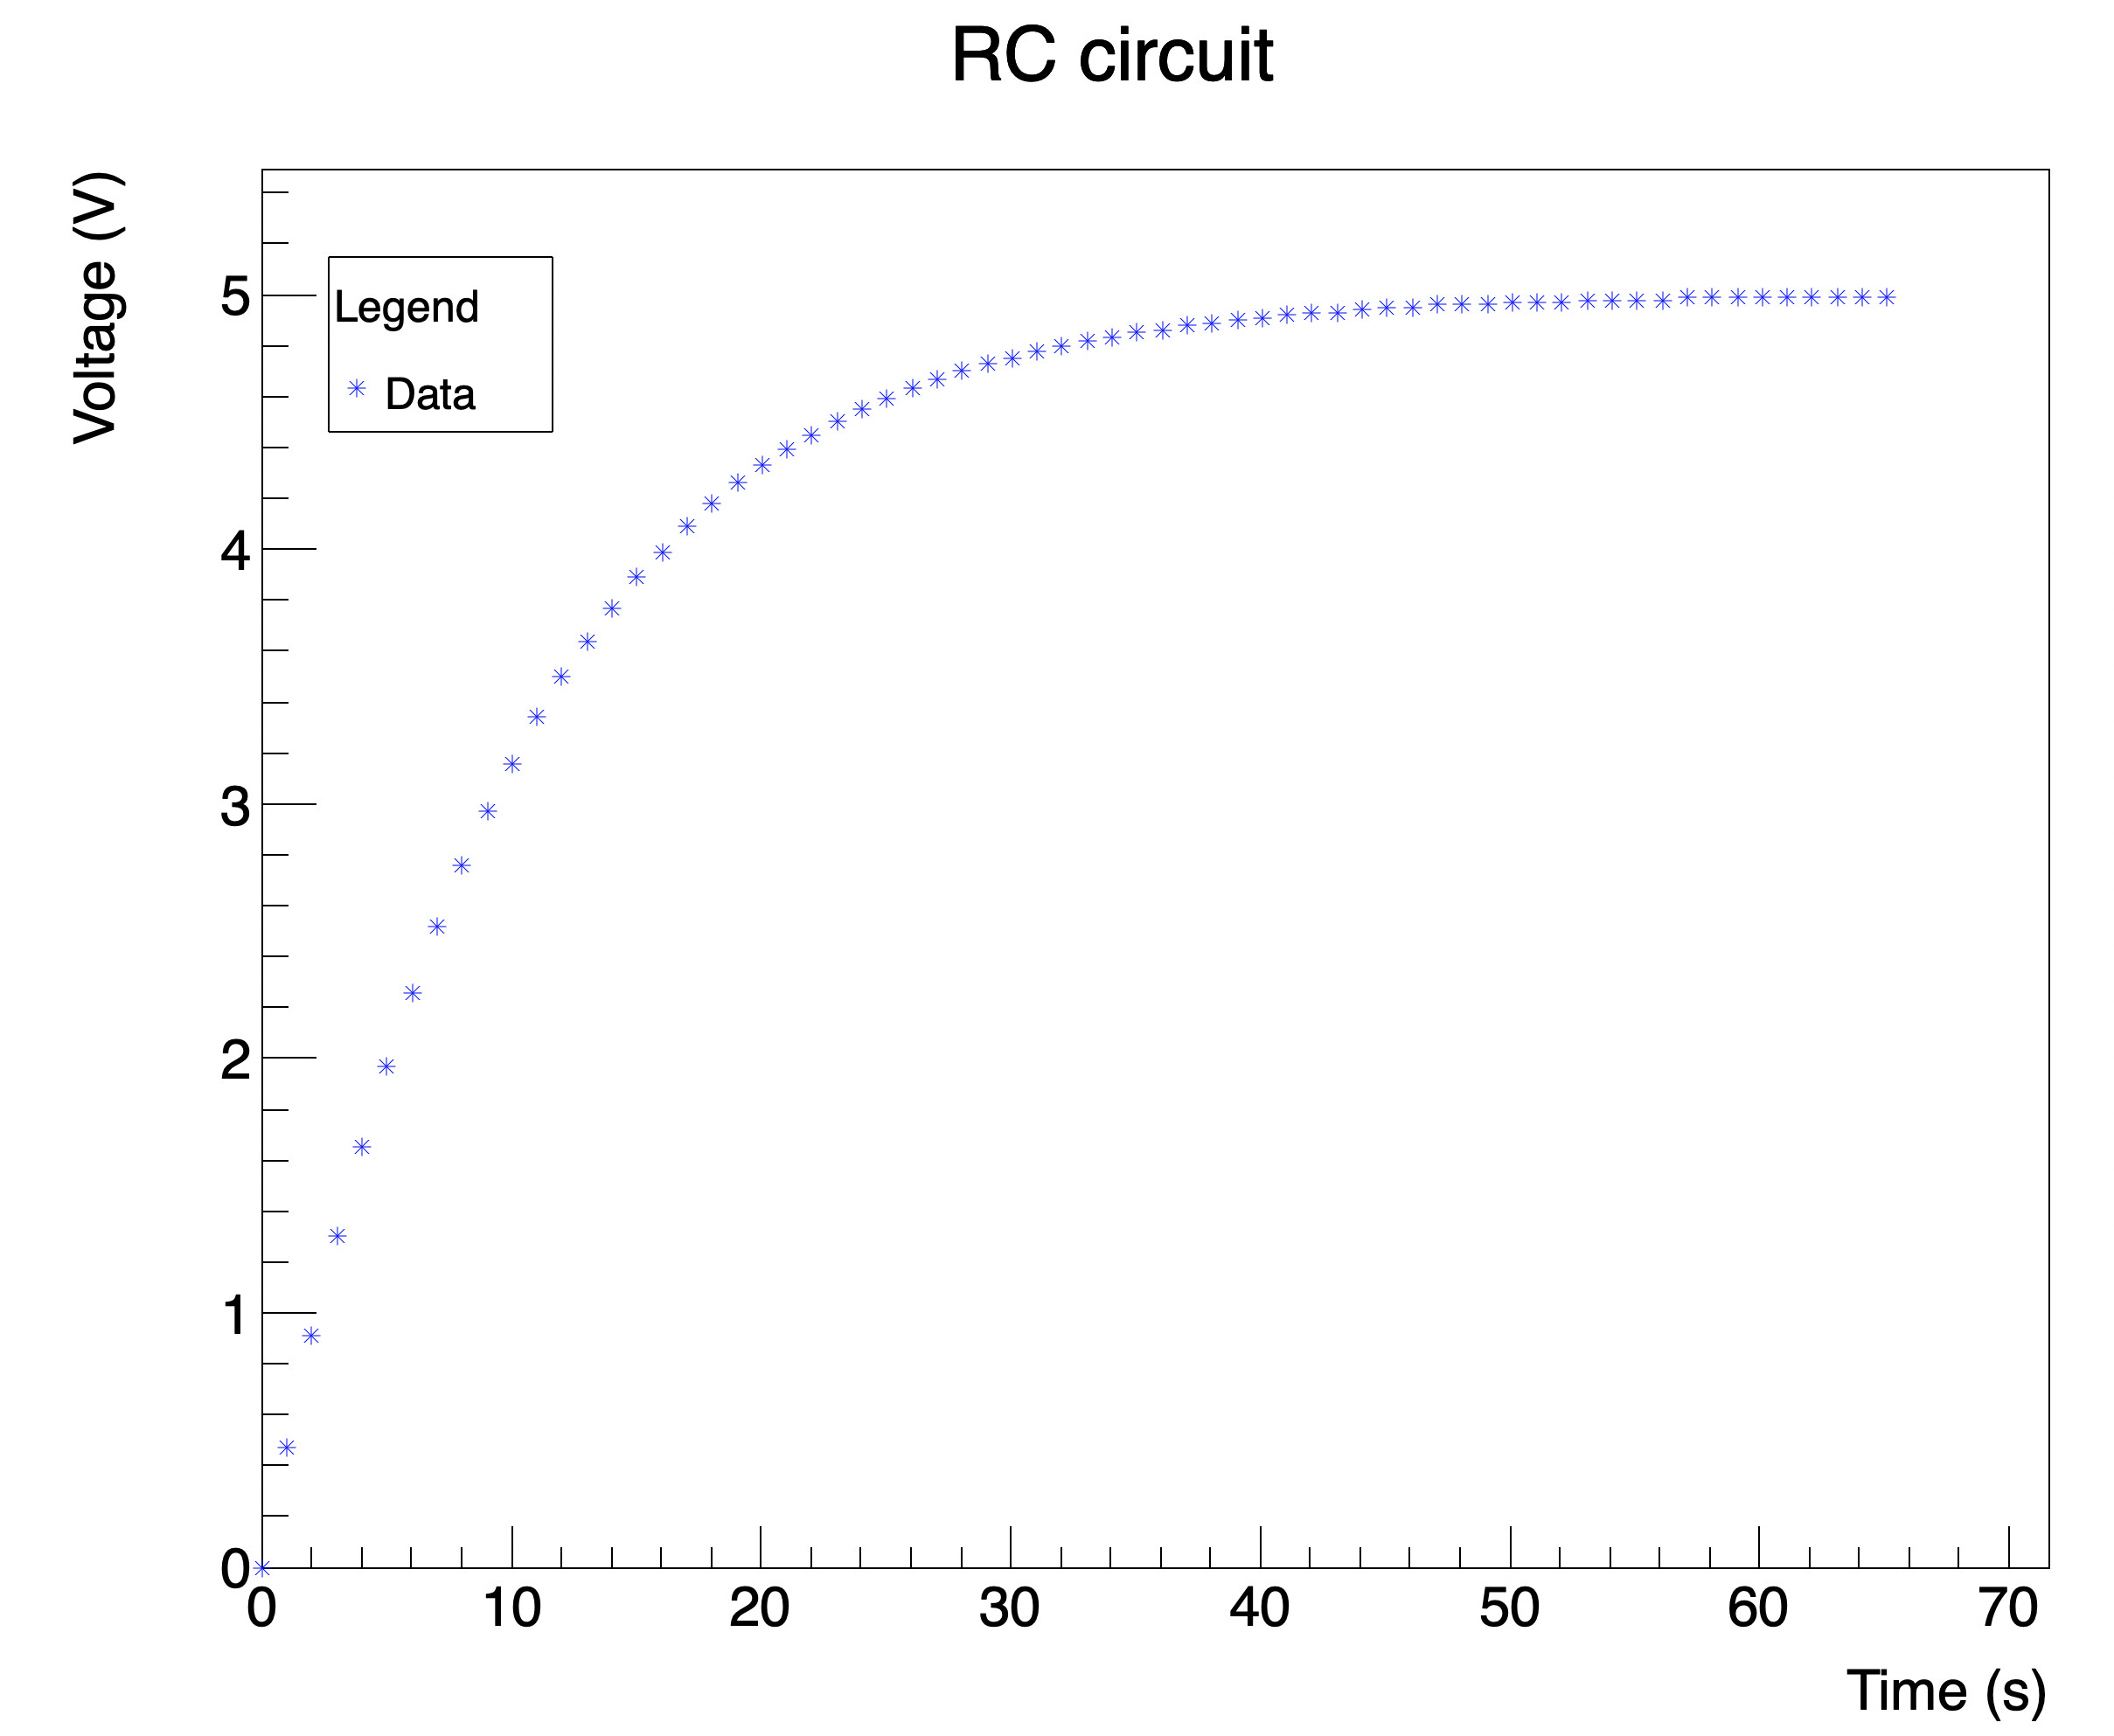
graph->SetTitle("RC circuit");
graph->GetXaxis()->SetTitle("Time (s)");
graph->GetYaxis()->SetTitle("Voltage (V)");
graph->GetYaxis()->SetTitleOffset(offy);
graph->GetXaxis()->SetTitleOffset(offx);
TLegend* leg = new TLegend(0.15, 0.75, .25, .85);
leg->SetHeader("Legend");
leg->SetNColumns(1);
leg->AddEntry(graph, "Data", "ap");
leg->Draw();
c01->Print(dataout);
}
faca87
February 4, 2021, 2:40pm
3
Thank you @couet … it worked, but I can’t notice what you fixed…can you tell me it please?
faca87:
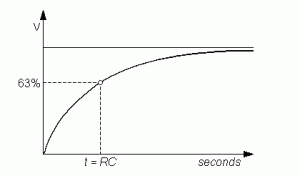
Moreover, I would add tow coordinates line as in this graph
faca87
February 4, 2021, 2:43pm
5
Oh yes! Now I noticed it! The stat box!
couet
February 4, 2021, 2:44pm
6
You will need to draw two dotted TLine and two TLatex at the proper positions.
faca87
February 4, 2021, 5:19pm
7
Thank you @couet , I did it!