Problem in TGraphPolar

Hi,

Does anyone know how to draw a TGraphPolar in the given data?
In the figure 1, I use the code from the user guide to plot a polar graph.


http://i.imgur.com/eRrR6j3.jpg

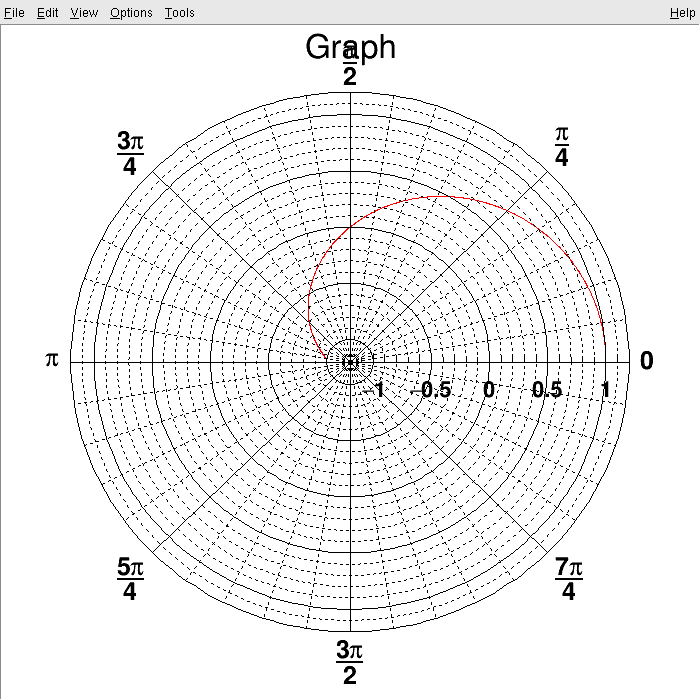
I want to limit the range from 0 to Pi, that is, just the upper half of the graph. I change the rmax to Pi. However, it cannot made the correct plot which I want.


http://i.imgur.com/J4KGFbI.jpg

Does anyone know how to solve this problem?

Thanks!

You have to limit theta from 0 to pi instead of the radius r.

I think that doesn’t affect the result because it is just the wrong parameter name which is written in user guide.
After I change the name of parameter, the result remains the same.


http://i.imgur.com/a2QZjrh.png

What do you want exactly ?

You were just missing to tell the TGraphPolar that your theta are radian (no idea what it expects by default). Then the polar graph is correct. Just add this:

CPol->Update();// Update, otherwise GetPolargram returns 0
grP1->GetPolargram()->SetToRadian();

Next time please post your script test2.cpp