Dear Root experts,
I have a problem on setting the range of a TGraphErrors plot. The comands that I wrote in the macro are the following:
  g->GetXaxis()->SetTitle("E (MeV)");
  g->GetXaxis()->SetRangeUser(1e-9,10.);
  g->GetYaxis()->SetTitle("Estimated/Ref");
  g->GetYaxis()->SetRangeUser(0.,4.5);
  gPad->Modified();
  gPad->Update();
For the y-axis no problem. However, for the x-axis it do not change whatever values I put in the comand GetXaxis. I am writing something wrong in the code. The plot is on log scale on the x-axis.
Best regards and thank you for your time, Alessandro Calamida.
ROOT Version: 6.2
I do not have an histogram. This is a TGraphError plot. I set the range of the axis as the manual says. Unfortunately for the x-axis they do not change, whatever value I put in it.
couet
May 24, 2022, 9:33am
4
This how-to also explain it for graphs.
 ifstream input("");

  vector<double> x;
  vector<double> y;
  vector<double> ex;
  vector<double> ey;

  Double_t outx=0;
  //Double_t outx2=0;
  //Double_t outxmed=0;
  Double_t outx_err=0;
  Double_t outy=0;
  Double_t outy_err=0;

  if(!input){cout<<"errore apertura file"<<endl;}

  while(input>>outx>>outy>>outy_err){
   //outxmed=(outx1+outx2)/2;
   x.push_back(outx);
   y.push_back(outy);
   ex.push_back(0);
   ey.push_back(outy_err);
  }
  Int_t j=x.size();

  TCanvas *spectrum=new TCanvas("Spectrum","Spectrum");
  spectrum->SetLogx();

  TGraphErrors *g=new TGraphErrors(j,&x[0],&y[0],&ex[0],&ey[0]);
  g->SetTitle("");
  g->SetLineWidth(2);
  g->SetLineColor(4);
  g->SetMarkerStyle(21);
  g->SetMarkerColor(4);

  g->Draw("AP");

  /*TLegend *legend = new TLegend(0.15,0.55,0.52,0.7);

  legend->SetFillColor(0);
  legend->SetLineColor(1);
  legend->SetTextSize(0.04);
  legend->AddEntry(g,"","lep");
  legend->Draw();*/

  g->GetXaxis()->SetTitle("E (MeV)");
  g->GetXaxis()->SetRangeUser(1e-9,10.);
  g->GetYaxis()->SetTitle("Estimated/Ref");
  g->GetYaxis()->SetRangeUser(0.,4.5);
  gPad->Modified();
  gPad->Update();

  spectrum->SaveAs("");

   x.clear();
   y.clear();
   ex.clear();
   ey.clear();
I can confirm that changing axis range for TGraph never worked for me as well, actually:
root --version
ROOT Version: 6.26/00
Built for linuxx8664gcc on Mar 03 2022, 06:51:13
From tags/v6-26-00@v6-26-00
Reproducable:
$ root
[0] TGraph gr
root [1] gr.SetPoint(0, 1, 1)
root [2] gr.SetPoint(1, 2, 4)
root [3] gr.SetPoint(2, 3, 9)
root [4] gr.SetPoint(3, 4, 16)
root [5] gr.SetPoint(4, 5, 25)
root [6] gr.Draw()
// Trying to change canvas range through the canvas interface
// 1. right-click on the x axis
// SetRangeUser() -> (-20, 20) -- doesn't work
couet
May 24, 2022, 10:56am
7
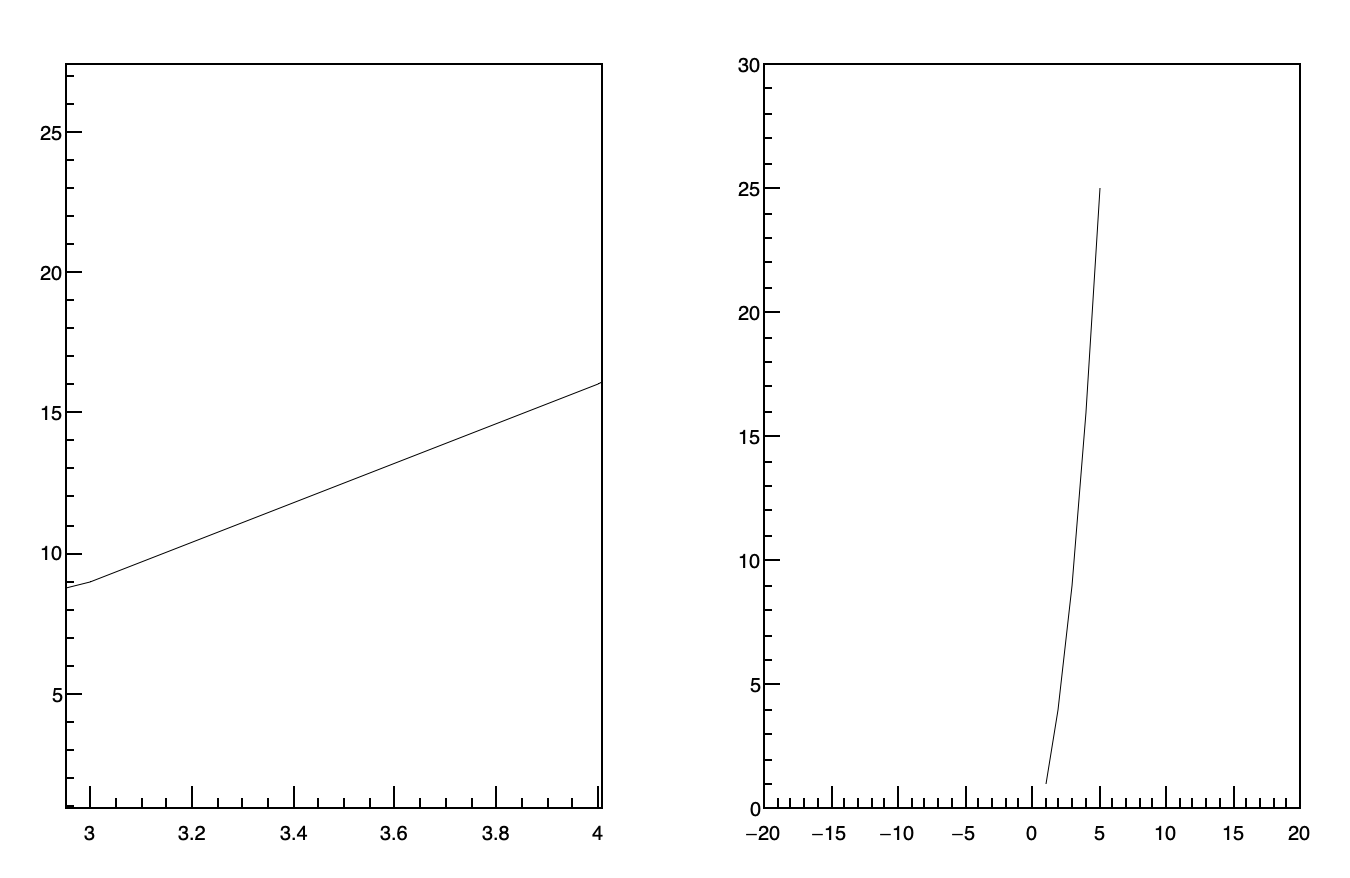
void foxwise() {
   auto C = new TCanvas();
   C->Divide(2,1);

   // SetRange can define smaller ranges (zoom)
   C->cd(1);
   auto gr1 = new TGraph();
   gr1->AddPoint(1, 1);
   gr1->AddPoint(2, 4);
   gr1->AddPoint(3, 9);
   gr1->AddPoint(4, 16);
   gr1->AddPoint(5, 25);
   gr1->Draw();
   gr1->GetXaxis()->SetRangeUser(3, 4);

   // Wider Ranges can be done this way:
   C->cd(2)->DrawFrame(-20, 0., 20., 30);
   auto gr2 = new TGraph();
   gr2->AddPoint(1, 1);
   gr2->AddPoint(2, 4);
   gr2->AddPoint(3, 9);
   gr2->AddPoint(4, 16);
   gr2->AddPoint(5, 25);
   gr2->Draw();
}
Thanks for the clarification.
I see the second method in the linked HowTo. However, it is just mentioned as an alternative, while I think it is fair to specify it is as the only working option for “unzooming”.
Also, as far as I understand, it makes drawing wider range from the canvas interface after the graph is drawn impossible?
I don’t know the implementation details and why it is impossible to unzoom with TGraph’s TAxis, while it works with TH1’s TAxis but I think it would be nice to have consistent behaviour with both. As it is very confusing for newbies and not only.
couet
May 24, 2022, 11:20am
9
It is the same with histograms:
root [0] auto h = new TH1F("h","h",100,-4,4)
root [1] h->Draw();
root [2] h->GetXaxis()->SetRangeUser(-10,10)
yes good point
Actually, for “graphs”, it is very easy to use any “arbitrary values” for the x-axis range:graph->GetHistogram()->GetXaxis()->SetLimits(xmin, xmax);
I tried in this way as suggested but unfortunately it did no work. I wrote the whole code down there:
R__LOAD_LIBRARY(libTreePlayer)#include #include #include #include #include
void Graph_Single(){
 ifstream input("");

  vector<double> x;
  vector<double> y;
  vector<double> ex;
  vector<double> ey;

  Double_t outx=0;
  //Double_t outx2=0;
  //Double_t outxmed=0;
  Double_t outx_err=0;
  Double_t outy=0;
  Double_t outy_err=0;

  if(!input){cout<<"errore apertura file"<<endl;}

  while(input>>outx>>outy>>outy_err){
   //outxmed=(outx1+outx2)/2;
   x.push_back(outx);
   y.push_back(outy);
   ex.push_back(0);
   ey.push_back(outy_err);
  }
  Int_t j=x.size();

  TCanvas *spectrum=new TCanvas("Spectrum","Spectrum");
  spectrum->SetLogx();
  spectrum->cd(1)->DrawFrame(1e-10, 0., 10., 5.);

  TGraphErrors *g=new TGraphErrors(j,&x[0],&y[0],&ex[0],&ey[0]);
  g->SetTitle("");
  g->SetLineWidth(2);
  g->SetLineColor(4);
  g->SetMarkerStyle(21);
  g->SetMarkerColor(4);

  g->Draw("AP");

  /*TLegend *legend = new TLegend(0.15,0.55,0.52,0.7);

  legend->SetFillColor(0);
  legend->SetLineColor(1);
  legend->SetTextSize(0.04);
  legend->AddEntry(g,"","lep");
  legend->Draw();*/

  g->GetXaxis()->SetTitle("E (MeV)");
  //g->GetXaxis()->SetRangeUser(1e-9,10.);
  g->GetYaxis()->SetTitle("Estimated/Ref");
  //g->GetYaxis()->SetRangeUser(0.,4.5);
  gPad->Modified();
  gPad->Update();

  spectrum->SaveAs("");

   x.clear();
   y.clear();
   ex.clear();
   ey.clear();
}
It is not an histogram, I tried that option but it do not work
couet
May 24, 2022, 11:36am
13
Your data file is missing but this version is ok:
void Graph_Single(){
ifstream input("");
vector<double> x;
vector<double> y;
vector<double> ex;
vector<double> ey;
Double_t outx=0;
Double_t outx_err=0;
Double_t outy=0;
Double_t outy_err=0;
if(!input){cout<<"errore apertura file"<<endl;}
while(input>>outx>>outy>>outy_err){
x.push_back(outx);
y.push_back(outy);
ex.push_back(0);
ey.push_back(outy_err);
}
Int_t j=x.size();
TCanvas *spectrum=new TCanvas("Spectrum","Spectrum");
spectrum->SetLogx();
spectrum->DrawFrame(1e-10, 0., 10., 5.);
TGraphErrors *g=new TGraphErrors(j,&x[0],&y[0],&ex[0],&ey[0]);
g->SetTitle("");
g->SetLineWidth(2);
g->SetLineColor(4);
g->SetMarkerStyle(21);
g->SetMarkerColor(4);
g->Draw("P");

}
ah, you are right. I got confused, because for histograms the drawing range is set to the initially specified bin range (-4, 4), independently if there is any data or not in the drawing range.
While for the TGraph range is always re-adjusts between x_min/x_max of the data points.c->DrawFrame()