Problem in plotting using MultiGraph

Hi,

I want to plot 4 different data sets using multigraph on the same plot.

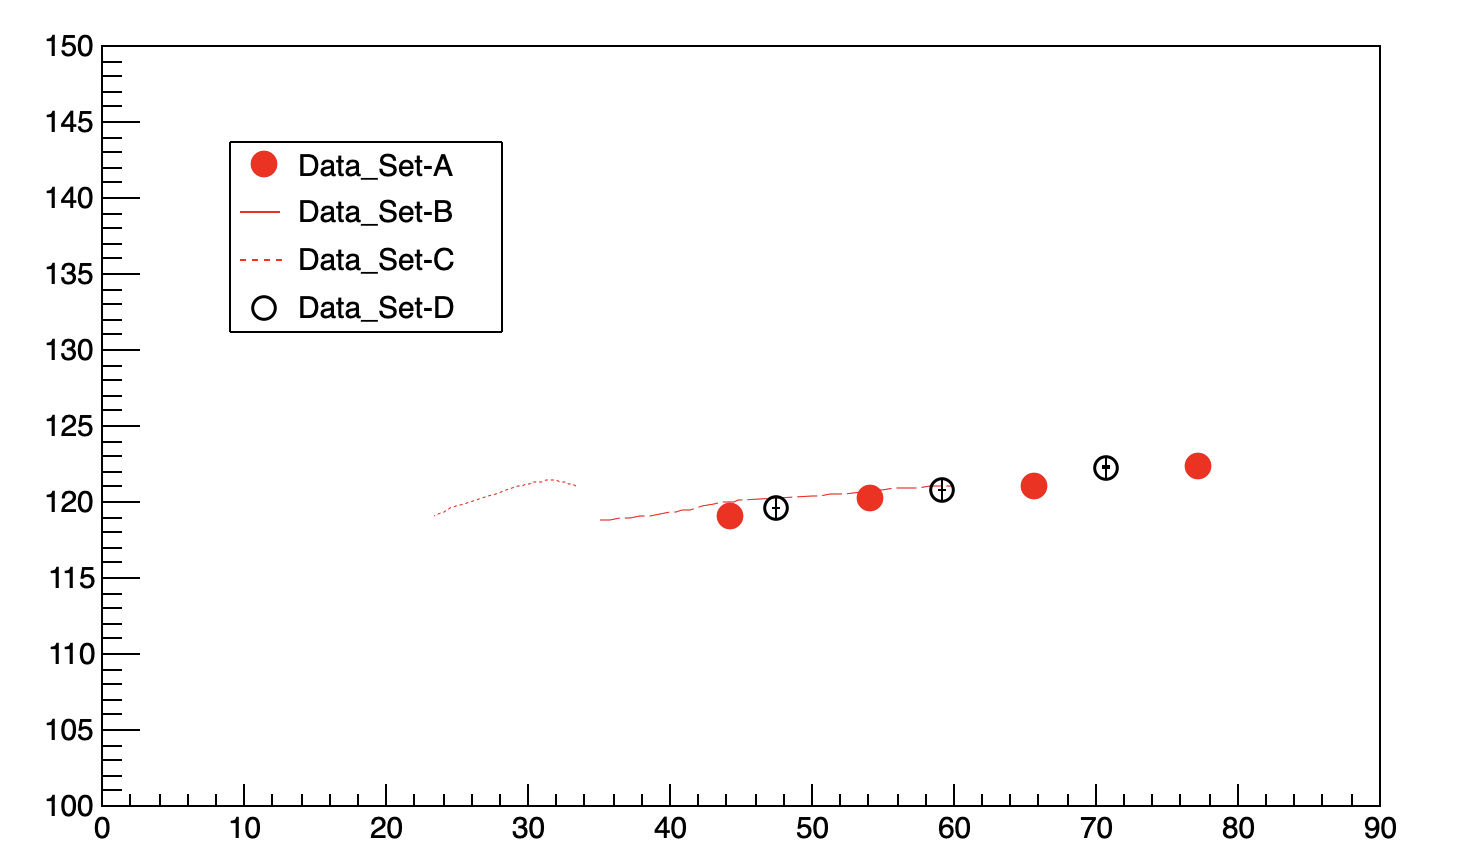
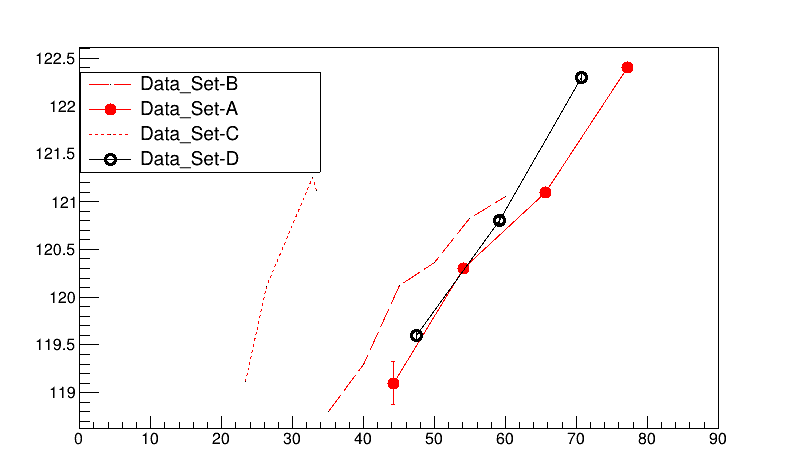
For Data set A and D I want to draw the markers with error bars(without joining the lines between them).

While for Data set B and C I want to draw lines through the point without markers.

The following is the macro that I us e:

Test_Multigraph.C (2.9 KB)

When I use the macro to plot the graphs, I have two problem:

  1. I am not able to set the range of the Y axis from 100 to 150
  2. For my data set A and D I dont want the data points to be joined with a line, so I use “AP” option to draw the current marker and the error, but unfortunately the data points are joined with a line . How to get rid of this ?

Thank you!

For 1, use SetMinimum and SetMaximum.
For 2, include the draw options you want for each graph when you are adding them, and do not include the line or marker options when you draw the multigraph.

  mg->Add(gau23,"l");
  mg->Add(gau_tri,"p");
  mg->Add(gau_tri1,"l");
  mg->Add(gir,"p");

  mg->GetXaxis()->SetLimits(0,90);
  mg->SetMinimum(100.);   // or alternatively, mg->GetHistogram()->SetMinimum(...) after mg->Draw()
  mg->SetMaximum(150.);   // same alternative as SetMinimum
  mg->Draw("A");
1 Like
{
   //---------------------------------- Data_Set-A ---------------------------------------
   int n_3 = 4;

   //double x_3[4]  = {33.347, 32.859, 26.337, 23.311};
   double x_3[4]  = {77.245, 65.692, 54.140, 44.2840};
   double y_3[4]  = {122.4, 121.1, 120.3, 119.1};

   double ex_3[4] = {0, 0, 0,0};
   double ey_3[4] = {0.02985, 0.02912, 0.04814, 0.2272};

   auto gau_tri = new TGraphErrors(n_3,x_3,y_3,ex_3,ey_3);
   gau_tri->SetTitle("Data_Set-A");
   gau_tri->SetMarkerColor(2);
   gau_tri->SetMarkerSize(1.6);
   gau_tri->SetMarkerStyle(8);

   //---------------------------------- Data_Set-B ---------------------------------------
   int n_23 = 6;

   double x_23[6]  = {35, 40, 45, 50, 55, 60};
   double y_23[6]  = {118.808, 119.300, 120.117, 120.362, 120.828, 121.054};

   auto gau23 = new TGraph(n_23,x_23,y_23);
   gau23->SetTitle("Data_Set-B");

   gau23->SetLineStyle(9);
   gau23->SetLineColor(2);

   //---------------------------------- Data_Set-C ---------------------------------------
   int n_31 = 4;

   double x_31[4]  = {33.347, 32.859, 26.337, 23.311};
   double y_31[4]  = {121.113, 121.25, 120.113, 119.119};

   auto gau_tri1 = new TGraph(n_31,x_31,y_31);
   gau_tri1->SetTitle("Data_Set-C");

   gau_tri1->SetLineStyle(2);
   gau_tri1->SetLineColor(2);

   //---------------------------------- Data_Set-D ---------------------------------------
   int n_1 = 3;

   double x_1[3]  = {70.7, 59.1, 47.5};
   double y_1[3]  = {122.3, 120.8, 119.6};

   double ex_1[3] = {0, 0, 0};
   double ey_1[3] = {0.0536, 0.03264, 0.0569};

   auto gir = new TGraphErrors(n_1,x_1,y_1,ex_1,ey_1);
   gir->SetTitle("Data_Set-D");

   gir->SetMarkerSize(1.6);
   gir->SetMarkerStyle(71);

   //---------------------------------- Drawing    ---------------------------------------
   TCanvas *c11 = new TCanvas("c11","c11_Paper",800,500);

   TMultiGraph *mg = new TMultiGraph();

   mg->Add(gau23, "C");
   mg->Add(gau_tri,"P");
   mg->Add(gau_tri1,"C");

   mg->Add(gir,"P");

   mg->GetXaxis()->SetLimits(0,90);
   mg->SetMinimum(100);
   mg->SetMaximum(150);
   mg->Draw("A");

   auto leg = new TLegend(0.18,0.6,0.35,0.8);
   leg->AddEntry(gau_tri,"Data_Set-A","p");
   leg->AddEntry(gau23,"Data_Set-B","l");
   leg->AddEntry(gau_tri1,"Data_Set-C","l");
   leg->AddEntry(gir,"Data_Set-D","p");
   leg->Draw();
}

1 Like