Hi,
I want to plot different data sets using multi graph as a function of date and time.
Unfortunately I get wrong results.
Attached here is the macro that I use.
Thank you
notworking.C (2.3 KB)
Hi,
I want to plot different data sets using multi graph as a function of date and time.
Unfortunately I get wrong results.
Attached here is the macro that I use.
Thank you
notworking.C (2.3 KB)
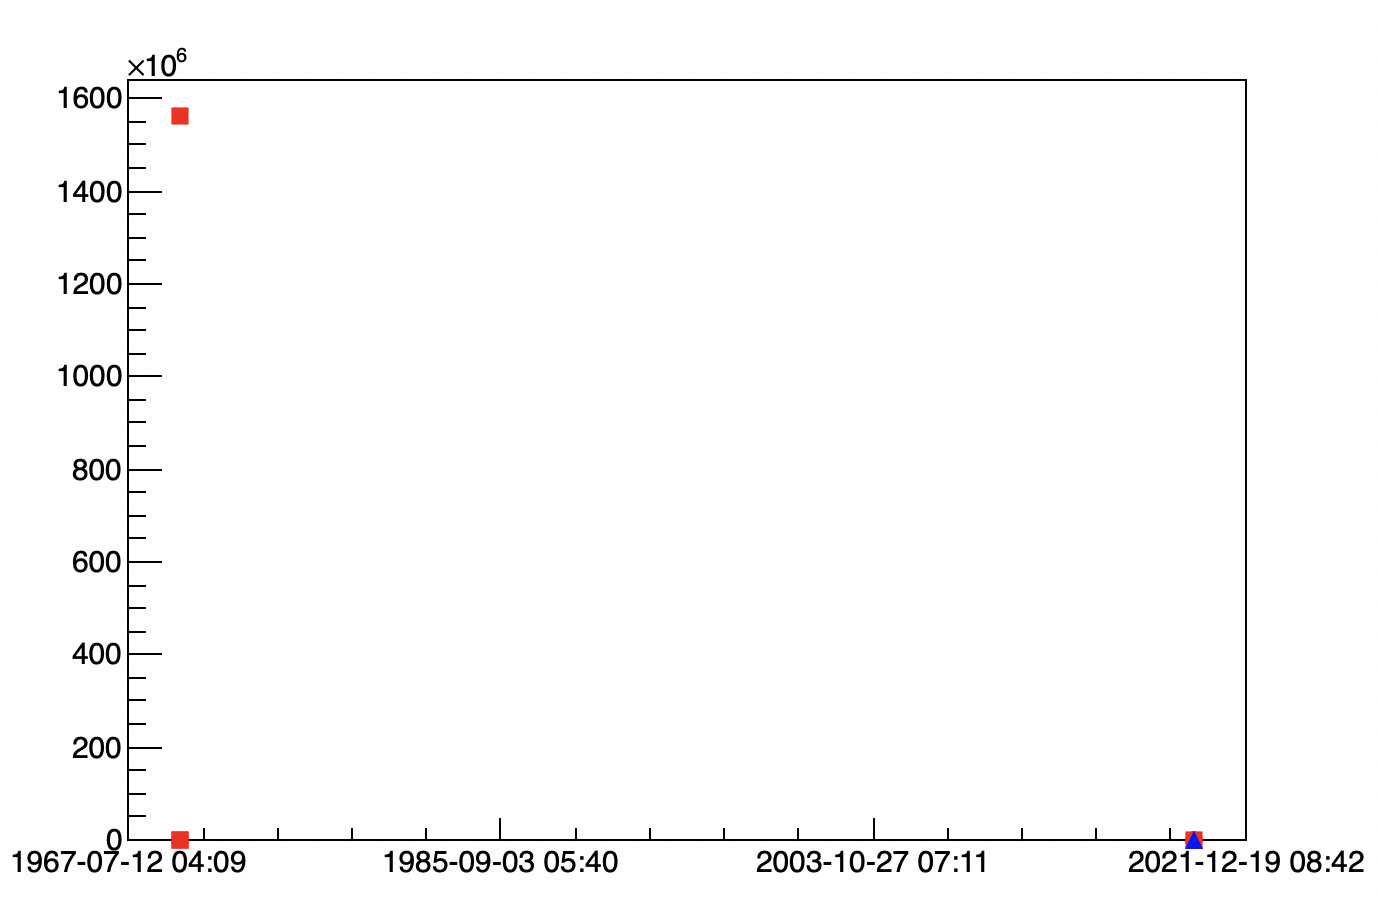
The x-axis values are wrong, it’s not the values that were given in the macro…
The x-axis that I have given in date as 29th June 2019 and the corresponding time… but its not what that it plots… similarly the y-axis points are in the range of 6000…
The problem comes from the graph gi. You define it this way:
// DATA3

   float c[2], d[2];
   TDatime da9(2019,06,29,14,53,00);

   c[0] = 6314.7;
   d[0] = da9.Convert();

   TGraph *gi = new TGraph(4,d,c); // <<<< 4 points
   gi->SetMarkerColor(2);
   gi->SetMarkerSize(1);
   gi->SetMarkerStyle(21);
   gi->SetLineColor(2);
it has 4 points but you define only the first one. The 3 others are undefined. That’s why you get this wrong plot.
Thank you!
I had one more question, I would like to plot the errors on the y-axis and the corresponding date and time on the x-axis, but since I have no error on the y-axis, how can I do it?
You should use TGraphErrors.
When I use TGraph errors, I have an error showing for arrays
{{
TDatime da1(2008,02,28,15,52,00);
TDatime da2(2008,02,28,15,53,00);
//---------------------------------- ---------------------------------------
int n_3 = 2;
float x_3[3], y_3[3], ex_3[3], ey_3[3] ;
//double x_3[4] = {33.347, 32.859, 26.337, 23.311};
x_3[0] = 77.245;
x_3[1] = 79.245;
y_3[0] = da1.Convert();
y_3[1] = da2.Convert();
ex_3[0] = 0;
ex_3[1] = 0;
ey_3[0] = 0;
ey_3[1] = 0;
auto gau_tri = new TGraphErrors(2,y_3,x_3,ey_3,ex_3);
gau_tri->SetTitle(“{}^{176}Os”);
gau_tri->SetMarkerColor(2);
gau_tri->SetMarkerSize(1);
gau_tri->SetMarkerStyle(8);
gau_tri->SetLineColor(2);
//---------------------------------- ---------------------------------------
TDatime da5(2019,06,29,9,06,00);// RUN032
TDatime da6(2019,06,29,11,06,00);// RUN034
TDatime da7(2019,06,29,12,26,00);// RUN037
int n_1 = 3;
float x_1[4], y_1[4], ex_1[4], ey_1[4] ;
y_1[4]  = {70.7, 59.1, 47.5};
x_1[4]  = {da5.Convert(), da6.Convert(), da7.Convert()};

ex_1[4] = {0, 0, 0};
ey_1[4] = {0,0,0};
auto gir = new TGraphErrors(n_1,x_1,y_1,ex_1,ey_1);
gir->SetTitle(“{}^{177}Ir”);
gir->SetMarkerSize(1.6);
gir->SetMarkerStyle(71);
//---------------------------------- Drawing ---------------------------------------
TCanvas *c11 = new TCanvas(“c11”,“c11_Paper”,800,500);
TMultiGraph *mg = new TMultiGraph();
mg->Add(gau_tri, “C”);
mg->Add(gir,“P”);
mg->SetMinimum(30);
mg->SetMaximum(80);
mg->Draw(“A”);
gPad->Update();
mg->GetXaxis()->SetTimeDisplay(1);
mg->GetXaxis()->SetNdivisions(-503);
mg->GetXaxis()->SetTimeFormat(“%Y-%m-%d %H:%M”);
mg->GetXaxis()->SetTimeOffset(0,“gmt”);
}
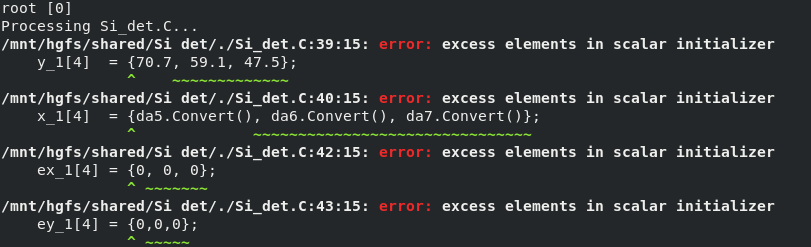
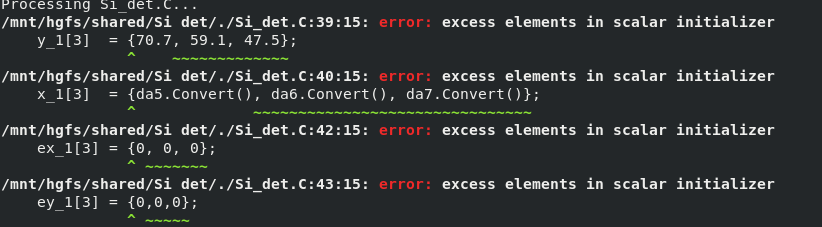
When I plot alone the first set of data it works, but when the second set of data is included I have errors…
Your array is size 4 et you provide 3 values.
Actually, you are declaring x_1, y_1, ex_1, and ey_1 to be arrays of 4 elements of type float. OTOH, you are assigning to one of the elements, e.g. ex_1[4] = ... (which, BTW, is also out of bounds).
I think you want to assign to the whole array instead (?); still you are missing one element, is that intentional?
As a suggestion, you can provide values as part of the initializer for the array (note that the missing element will be set to 0.0f), as in
float x_1[4]{70.7, 59.1, 47.5};
// [same for the others...]
Cheers,
J.
void gini() {

   TDatime da1(2008,02,28,15,52,00);
   TDatime da2(2008,02,28,15,53,00);

   //---------------------------------- ---------------------------------------
   int n_3 = 2;
   float x_3[3], y_3[3], ex_3[3], ey_3[3] ;

   //double x_3[4] = {33.347, 32.859, 26.337, 23.311};
   x_3[0] = 77.245;
   x_3[1] = 79.245;
   y_3[0] = da1.Convert();
   y_3[1] = da2.Convert();

   ex_3[0] = 0;
   ex_3[1] = 0;
   ey_3[0] = 0;
   ey_3[1] = 0;

   auto gau_tri = new TGraphErrors(2,y_3,x_3,ey_3,ex_3);
   gau_tri->SetTitle("{}^{176}Os");
   gau_tri->SetMarkerColor(2);
   gau_tri->SetMarkerSize(1);
   gau_tri->SetMarkerStyle(8);
   gau_tri->SetLineColor(2);

   //---------------------------------- ---------------------------------------

   TDatime da5(2019,06,29,9,06,00);// RUN032
   TDatime da6(2019,06,29,11,06,00);// RUN034
   TDatime da7(2019,06,29,12,26,00);// RUN037

   int n_1 = 3;

   float y_1[3]  = {70.7, 59.1, 47.5};
   float x_1[3]  = {(float)da5.Convert(), (float)da6.Convert(), (float)da7.Convert()};

   float ex_1[3] = {0, 0, 0};
   float ey_1[3] = {0,0,0};

   auto gir = new TGraphErrors(n_1,x_1,y_1,ex_1,ey_1);
   gir->SetTitle("{}^{177}Ir");

   gir->SetMarkerSize(1.6);
   gir->SetMarkerStyle(71);

   //---------------------------------- Drawing ---------------------------------------
   TCanvas *c11 = new TCanvas("c11","c11_Paper",800,500);

   TMultiGraph *mg = new TMultiGraph();

   mg->Add(gau_tri, "C");
   mg->Add(gir,"P");

   mg->SetMinimum(30);
   mg->SetMaximum(80);
   mg->Draw("A");
   gPad->Update();

   mg->GetXaxis()->SetTimeDisplay(1);
   mg->GetXaxis()->SetNdivisions(-503);
   mg->GetXaxis()->SetTimeFormat("%Y-%m-%d %H:%M");
   mg->GetXaxis()->SetTimeOffset(0,"gmt");

}