Problem in fitting same histogram

Hi,

I try to fill the same histogram using two different methods ie.,

  1. the " histogram fill option "
    h2->Fill(y,x);

  2. “the set bin content of the histogram”
    h3->SetBinContent(i,x);

(please see the attached macro.)
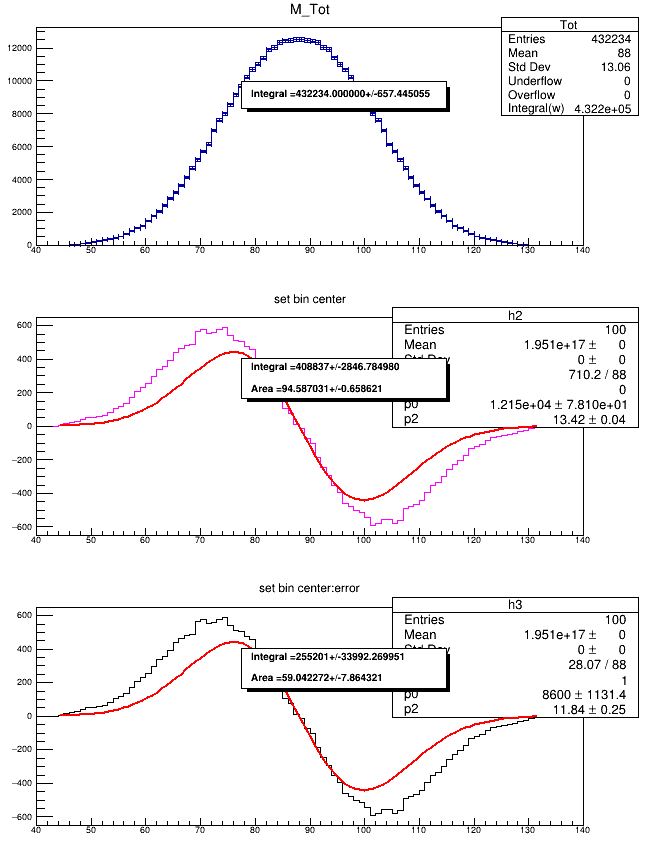
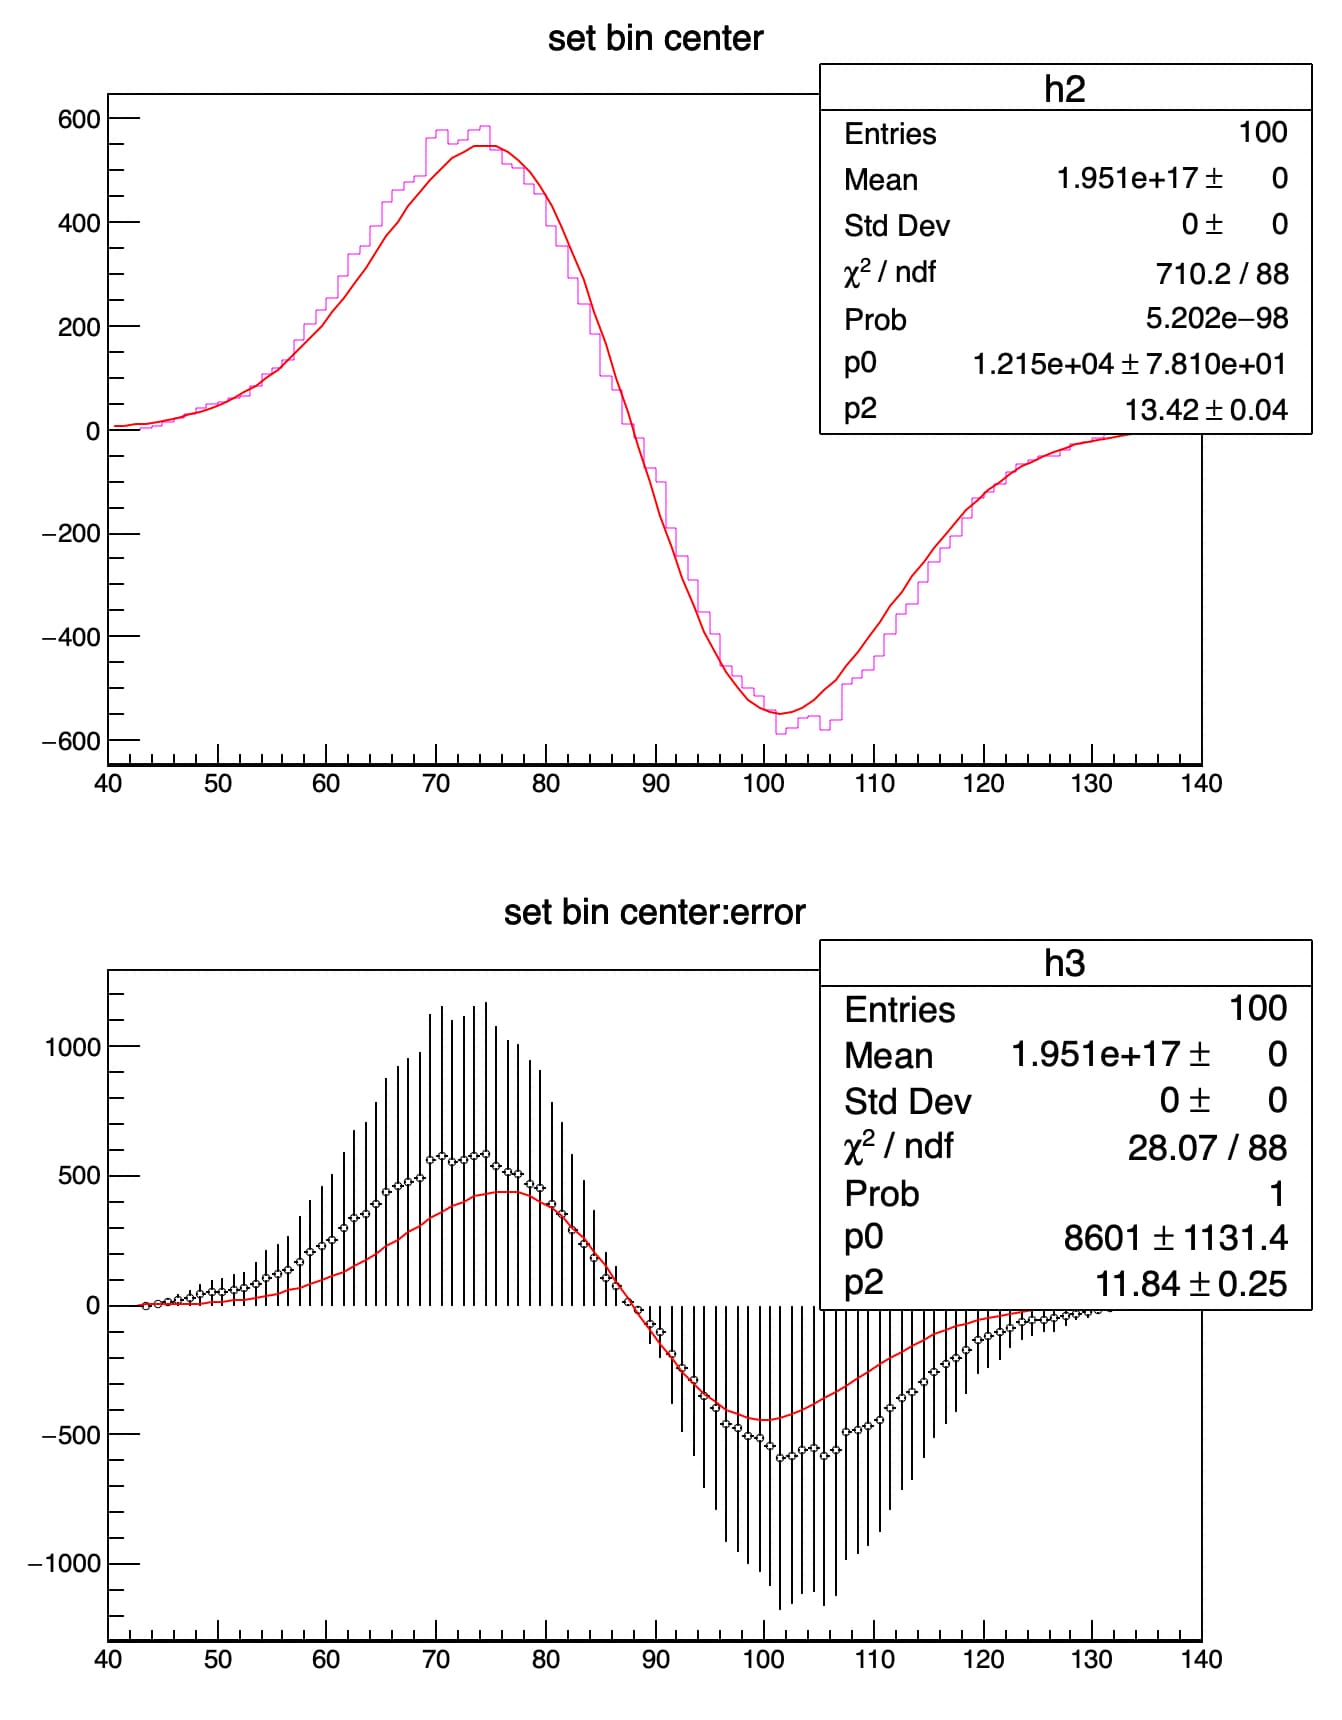
Now I try to fit the two histograms h2 and h3 using the same user-defined fit function. Even though the same histogram is filled in two different ways, what I see is that the fit results are different and I don’t understand the reason why ? As far as I understand both should have same fit results but its not what I get, can someone help me understand why ?

Here I attach the necessary macro and output for your consideration.

Thank you
Demo.C (4.8 KB)
Tot.root (6.0 KB)

I simplifed your macro and removed the option HISt to draw the histograms. IOne can see they are different regarding errors:

Double_t fit_firstder_one(Double_t *x1_one, Double_t *par1_one)
 {
    Double_t arg1_one   = 0;
    Double_t arg1_0_one = 0;
    if (par1_one[2] != 0)
    {
       arg1_one   = (x1_one[0] - par1_one[1])/par1_one[2];
       arg1_0_one = (x1_one[0] - par1_one[1])/(par1_one[2]*par1_one[2]);
    }

    Double_t fitval1_one= -par1_one[0]*TMath::Exp(-0.5*arg1_one*arg1_one)*arg1_0_one;
    return fitval1_one;
 }

void Demo() {
   gStyle->SetOptStat(2211);
   gStyle->SetOptFit(1111);

   // DEFINING CANVAS
   TCanvas *c1 = new TCanvas("c1","Without constraint",700,900);
   c1->Divide(1,2);

   TH1D*h2 = new TH1D("h2","set bin center", 100,40,140);
   TH1D*h3 = new TH1D("h3","set bin center:error", 100,40,140);

   Double_t LowerLimit_Mass_one = 44;
   Double_t UpperLimit_Mass_one  = 132;

   Int_t no_par_one = 3;

   TFile *file1=new TFile("Tot.root");
   TH1D *h1 = (TH1D*)file1->Get("Tot");

   Double_t error_A;
   Double_t A = h1->IntegralAndError(1, h1->GetNbinsX(), error_A, "");

   Double_t error_A1;
   Double_t A1 = h1->IntegralAndError(0, (h1->GetNbinsX() + 1), error_A1, ""); // "" or "width"


   //--------------- Fitting first derivative with 1 gauss -----------------------

   TF1 *f12_firstder_one_root = new TF1("fit_firstder_one_root",fit_firstder_one ,LowerLimit_Mass_one,UpperLimit_Mass_one,no_par_one);
   f12_firstder_one_root ->SetLineColor(2);

   f12_firstder_one_root ->SetParameter(0,1000);
   f12_firstder_one_root ->SetParLimits(0,1.5,1e8);

   f12_firstder_one_root->FixParameter(1, 88);

   f12_firstder_one_root ->SetParameter(2, 13);
   f12_firstder_one_root ->SetParLimits(2,1,30);

   Int_t nbins = h1->GetNbinsX();

   for (Int_t i=0;i<nbins;i++) {
      double a=h1->GetBinContent(i);
      double a_cent=h1->GetBinCenter(i);
      double a_err=h1->GetBinError(i);

      double h=h1->GetBinContent(i+6);
      double h_cent=h1->GetBinCenter(i+6);
      double h_err=h1->GetBinError(i+6);

       //7 bins
      double d_7_gauss = (h-a)/(h_cent-a_cent);
      double d_mid_7_gauss = (h_cent+a_cent)/2;
      double d_mid_7_gauss_err = (1/(h_cent-a_cent))*TMath::Sqrt(pow(h_err,2)+pow(a_err,2));

      h2->SetBinContent(i+3,d_7_gauss);
      h3->Fill(d_mid_7_gauss,d_7_gauss);
   }

   c1->cd(1);
   h2->SetMarkerStyle(24);
   h2->SetMarkerColor(1);
   h2->SetLineColor(6);
   h2->SetMarkerSize(0.4);
   h2->Draw();
   h2->Fit("fit_firstder_one_root");

   c1->cd(2);
   h3->SetMarkerStyle(24);
   h3->SetMarkerColor(1);
   h3->SetLineColor(1);
   h3->SetMarkerSize(0.4);
   h3->Draw();
   h3->Fit("fit_firstder_one_root");
}

So even if I don’t plot my errors (just use HIST FOR PLOTTING HISTOGRAM), root still considers the errors before fitting it and that’s why I have different fit results…

Yes, HIST is purelly graphical.

You need:

   h3->Sumw2(kFALSE);
   h3->Draw();

Thanks @couet for the clarification.

And I see that if I propagate the errors and assign it to each bin points in both the histograms I have the same results fo the fit…

Also as seen from your plot of h3, the errors in h3 are meaningless, yes as you suggested I used
h3->Sumw2(kFALSE); before drawing it, but I don’t really understand like what it does…

https://root.cern/doc/master/classTH1.html#aefa4ee94f053ec3d217f3223b01fa014

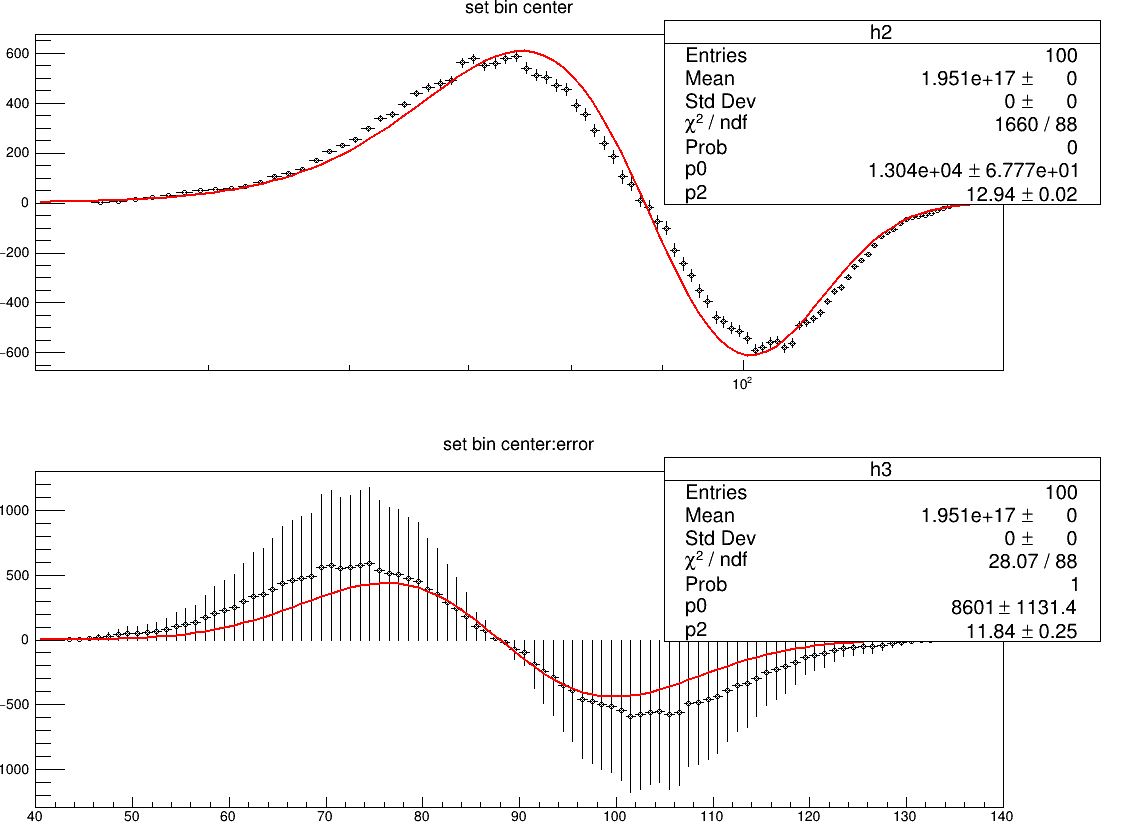
Here if I plot h2 after filling its bins with estimated error (and fill each bins using SetBinError), and plot using the histogram drawing option “E” to visualize the errors I see it plots the errors for both the X and Y. How is this so, as far as I understand I had only assigned errors to the Y-values for h2. And if I want to assign errors to X I need convert the same histogram into TGraphErrors right ? if this is so :

  1. What does the error bars on X correspond to, and how is it estimated by root ? (see attachment

    )
  2. Will the plotted error bars for the X axis (errors shown on corresponding bincenters ) be considered while making the fit ?

Thank you

I guess @moneta can help.

1 Like

Hi,

Regarding the errors plotted along the X and Y. I see that if I make a histogram and fill it using random numbers and plot with histogram drawing option “E”, I see that the errors are plotted for both X and Y. I am really confused now, what does this errors along X correspond to and how is it estimated in root ?

Thank you!

Hi,

from my understanding, the bins of a histogram define ranges on the X axis. The error bar represents the uncertainty of the x value (x can take any value within the range).

Cheers

If so then how are these errors on the X values estimated ? :thinking:

They are just the width of the bins.