For that, First I have to install ROOT 6 and then paste the following in my bash file???
alias root-53436='source /opt/ROOT/releases/root_v5.34.36/bin/thisroot.sh'
alias root-60902='source /opt/ROOT/releases/root_v6.09.02/bin/thisroot.sh'
alias root-61004='source /opt/ROOT/releases/root_v6.10.04/bin/thisroot.sh'
alias root-old="root-53436"
alias root-pro="root-60902"
alias root-new="root-61004"
alias root-dev="root-61004"
alias root-5="root-old"
alias root-6="root-new"
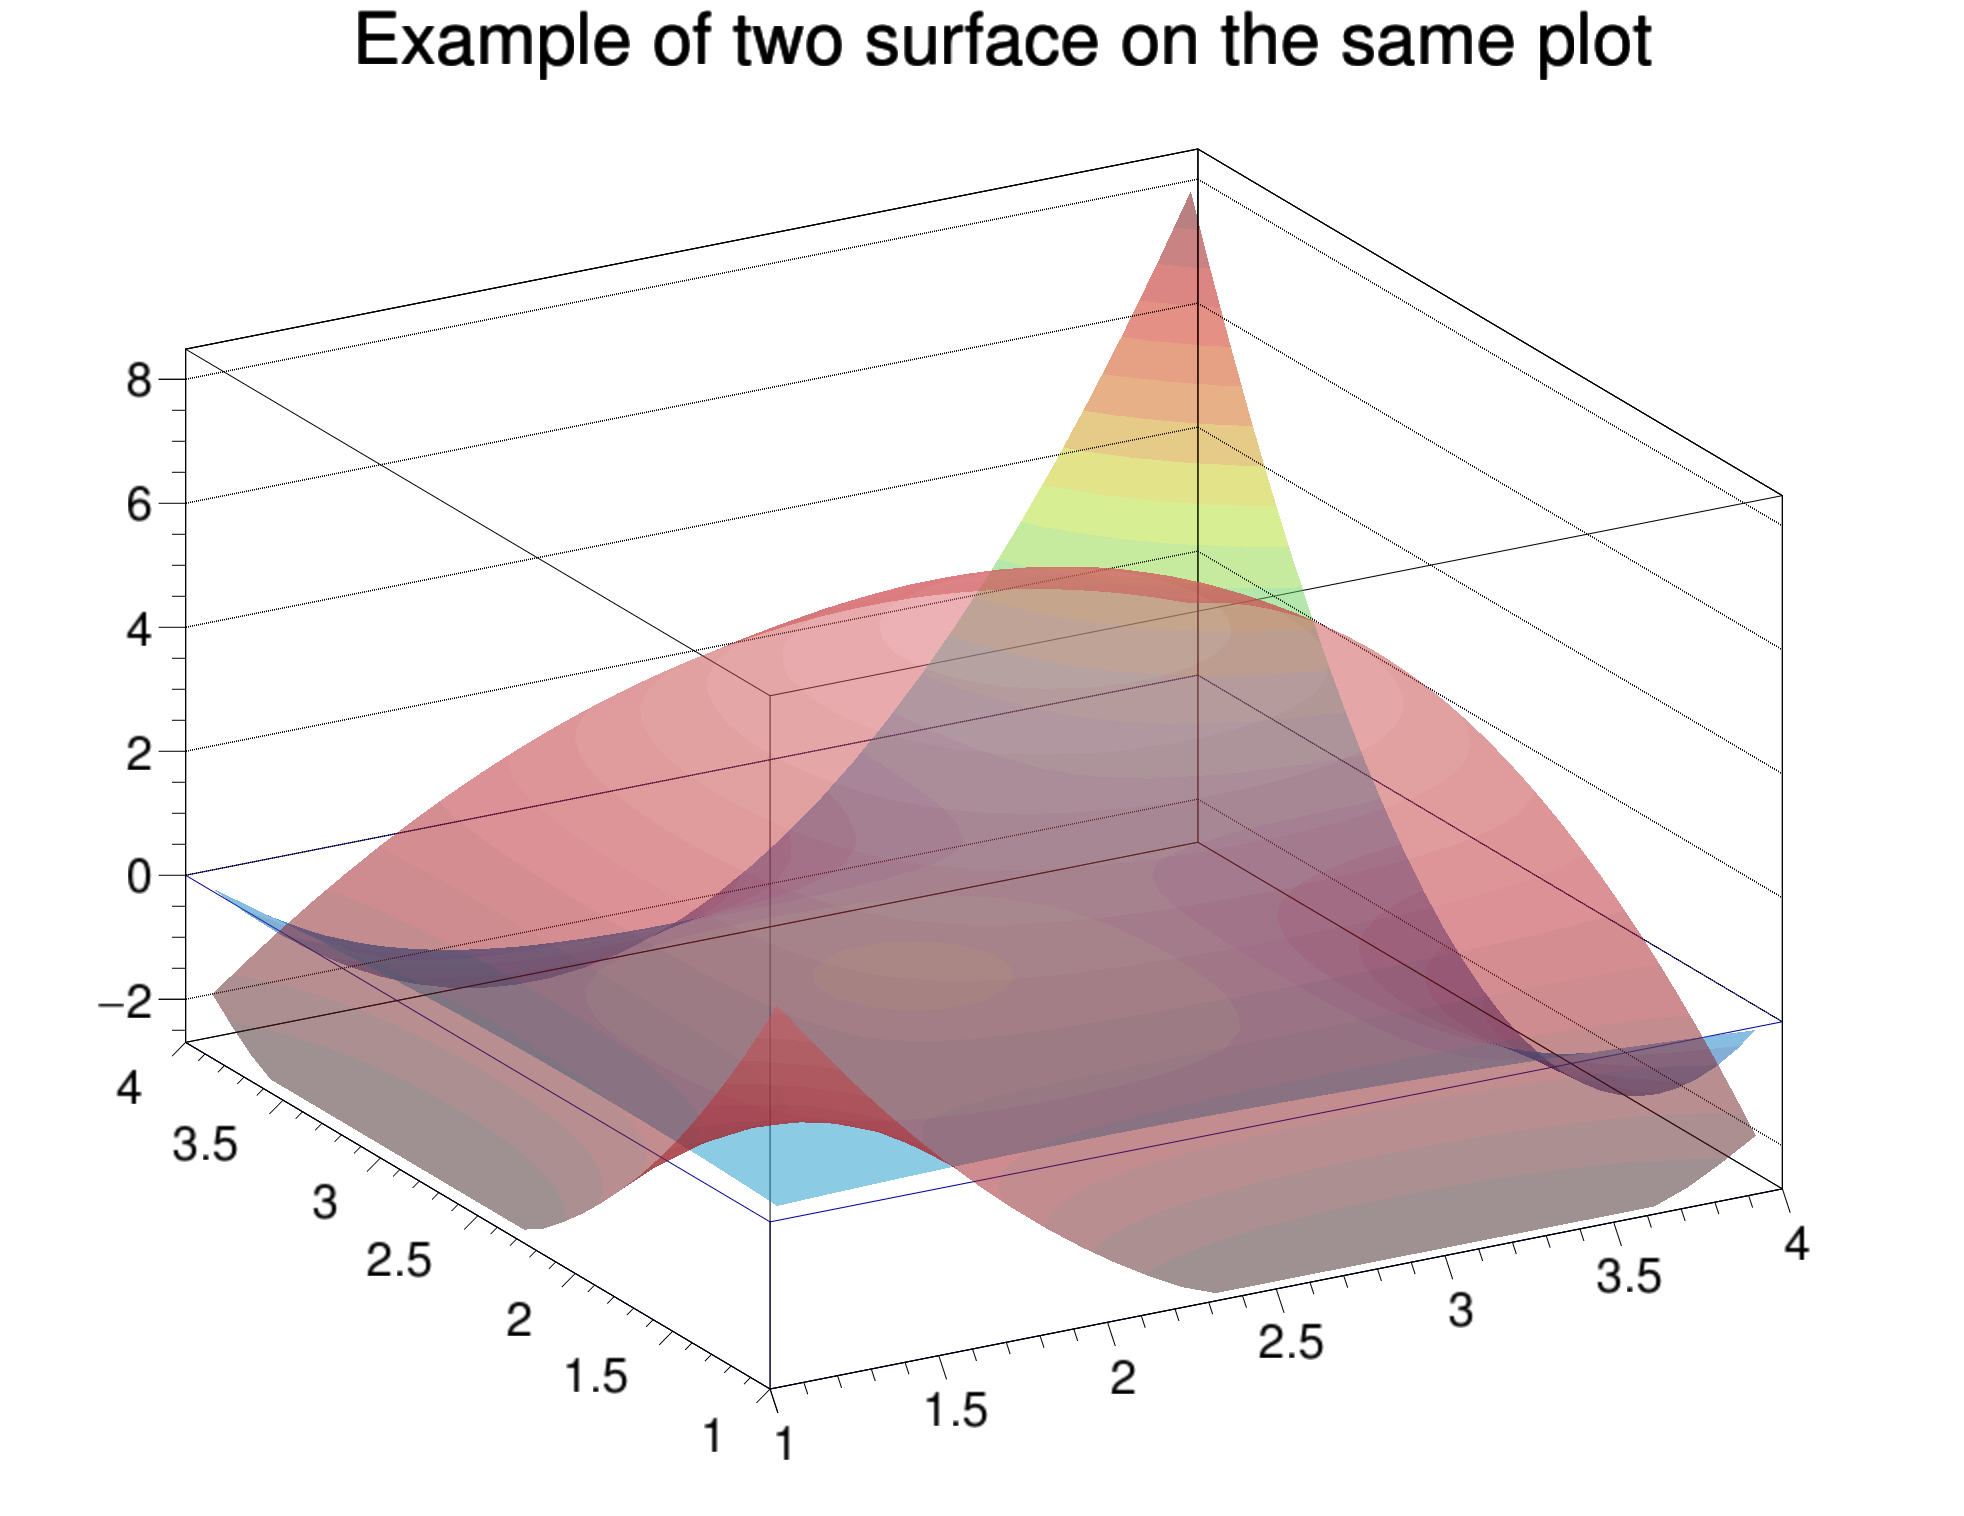
To be complete on the graphics side: one should be also careful that all the histograms you are superimposing on the same plot have exactly the same ranges in all directions. Here is the version of the macro doing that. multi5.C (1.1 KB)
What I am seeing that only 52, 53, and 55 are giving color transparency.
Anyway, I have a request:
Since this QA series was more about plotting, could you please remove only the function part in my first post? As that functional form is under research, I do not want to disclose that. Thank you for your understanding.
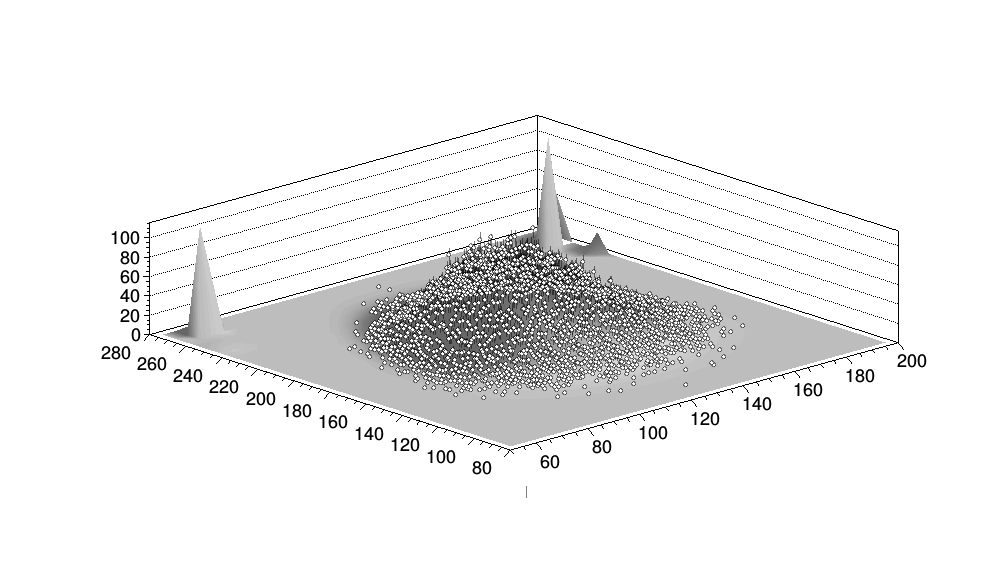
You anyhow go through an “intermediate” histogram so maybe use its integral.
Otherwisse, you would need to create a TF2 from your 2D graph and integrate this new function.
An example of a TF1 created from a 1D graph can be found in: “Integral of TGraph”