#include "TF2.h"
#include "TH2.h"
#include "TGraph2DErrors.h"
#include "TAxis.h"
#include "TMath.h"
#include "TCanvas.h"
#include "TStyle.h"
Double_t g2(Double_t *x, Double_t *par) {
Double_t r1 = Double_t((x[0]-par[1])/par[2]);
Double_t r2 = Double_t((x[1]-par[3])/par[4]);
return par[0]*TMath::Exp(-0.5*(r1*r1+r2*r2));
}
Double_t fun2(Double_t *x, Double_t *par) {
Double_t *p1 = &par[0];
Double_t *p2 = &par[5];
Double_t *p3 = &par[10];
Double_t result = g2(x,p1) + g2(x,p2) + g2(x,p3);
return result;
}
void example_graph() {
gStyle->SetCanvasPreferGL(kTRUE);
gStyle->SetOptStat(0);
gStyle->SetOptTitle(0);
TCanvas *c = new TCanvas();
const Int_t npar = 15;
Double_t f2params[npar] = {100,-3,3,-3,3,160,0,0.8,0,0.9,40,4,0.7,4,0.7};
TF2 *f2 = new TF2("f2",fun2,-10,10,-10,10, npar);
f2->SetParameters(f2params);
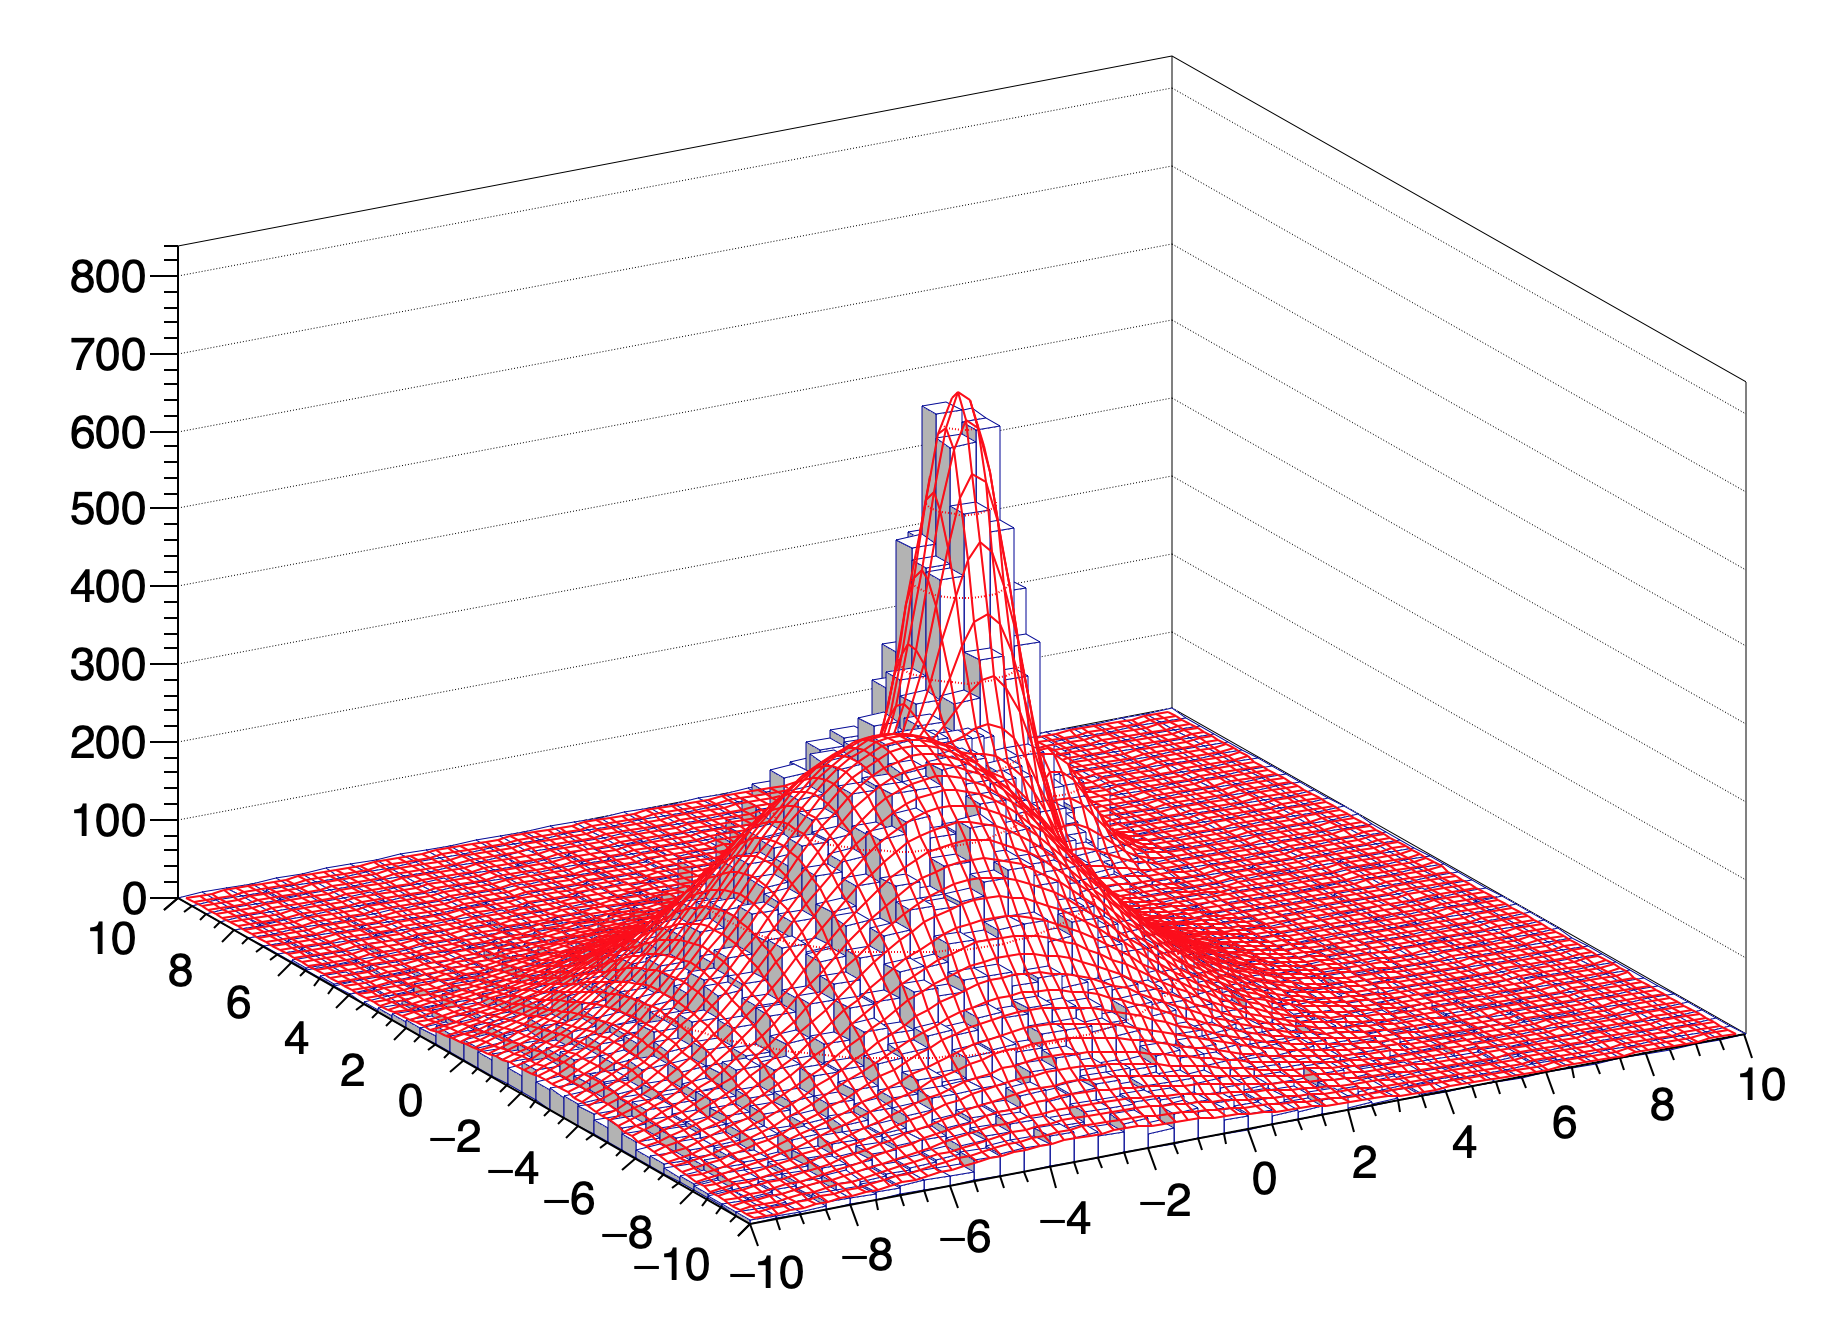
//Create an histogram and fill it randomly with f2
TH2F *h2 = new TH2F("h2","From f2",40,-10,10,40,-10,10);
Int_t nentries = 100000;
h2->FillRandom("f2",nentries);
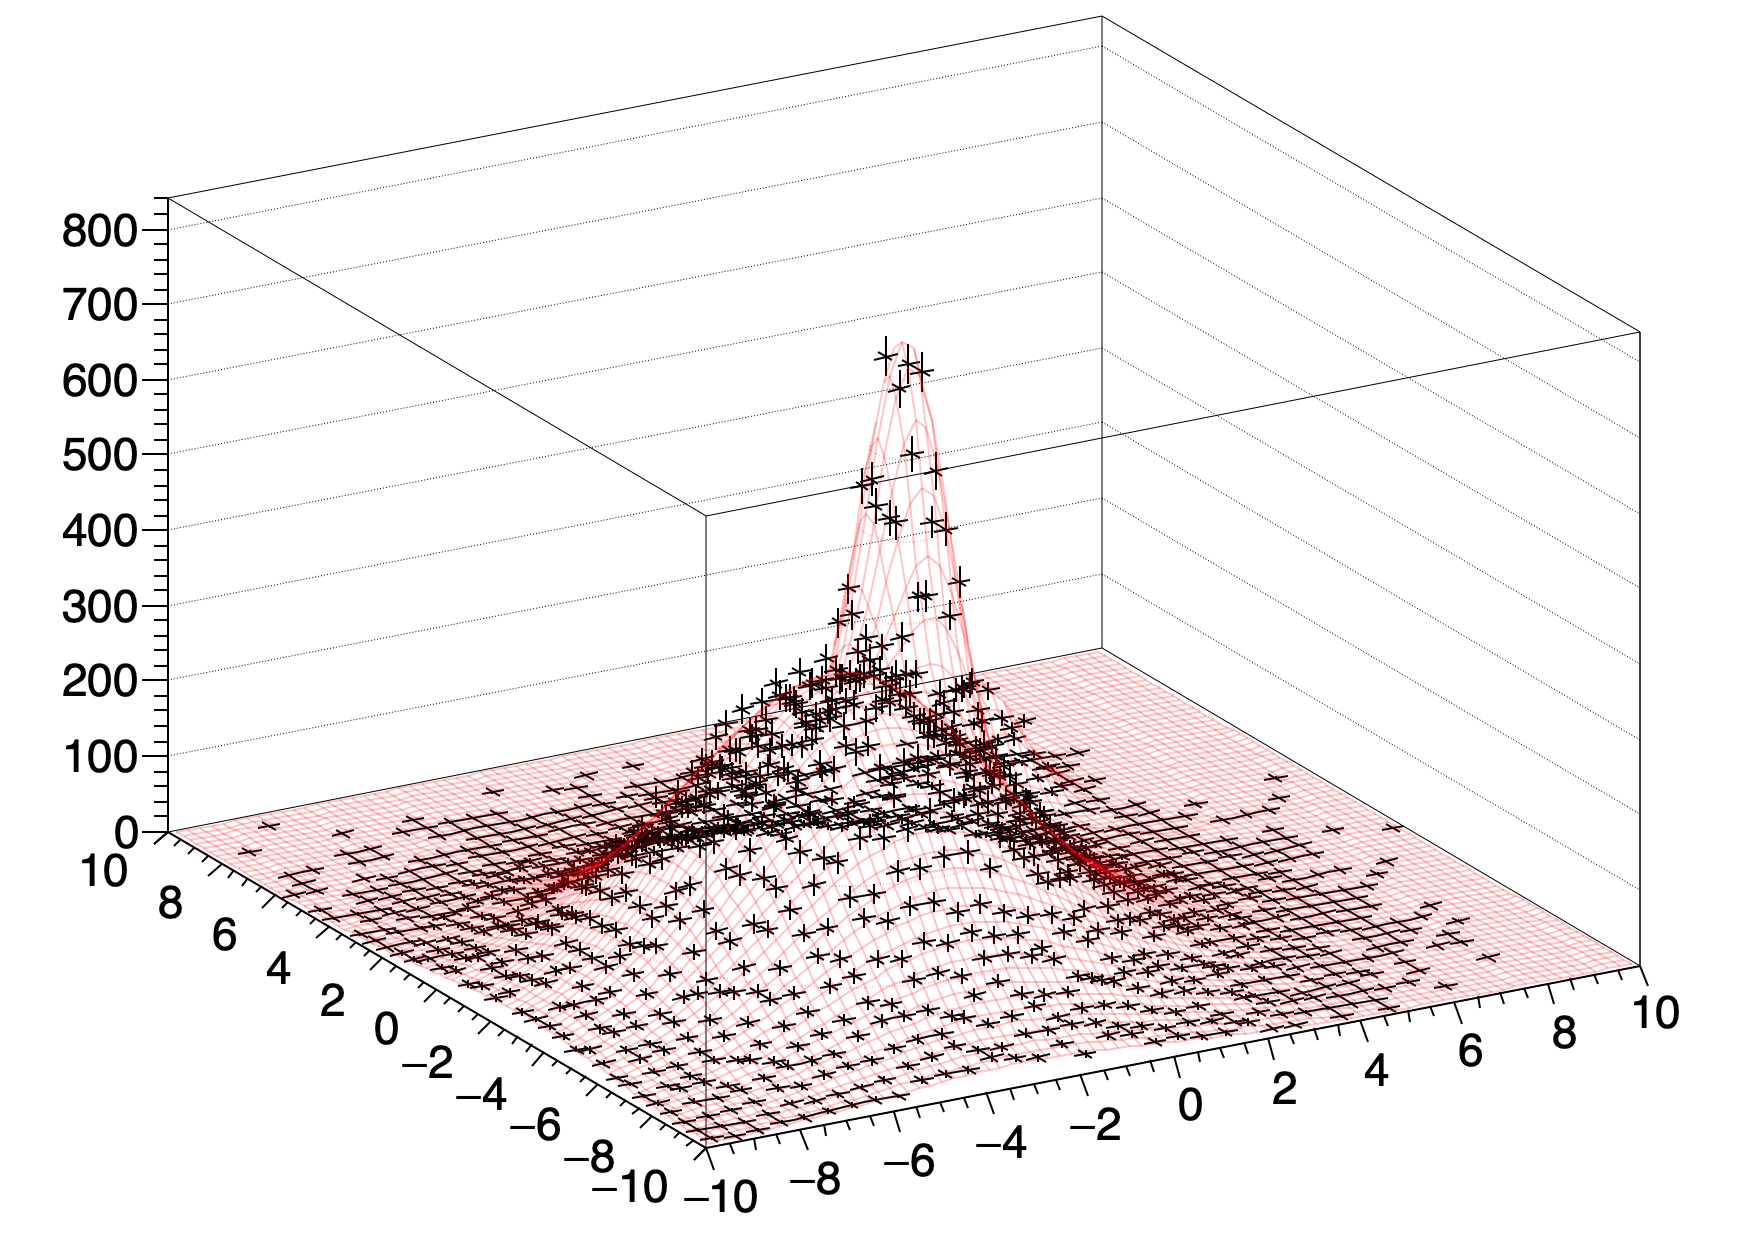
TGraph2DErrors *g =
new TGraph2DErrors((h2->GetNbinsX() * h2->GetNbinsY()));
for (int i = 1; i <= h2->GetNbinsX(); i++)
for (int j = 1; j <= h2->GetNbinsY(); j++) {
g->SetPoint( ((i - 1) * h2->GetNbinsY() + (j - 1)),
h2->GetXaxis()->GetBinCenter(i), // x
h2->GetYaxis()->GetBinCenter(j), // y
h2->GetBinContent(i, j) ); // z
#if 1 /* 0 or 1 */
g->SetPointError( ((i - 1) * h2->GetNbinsY() + (j - 1)),
0., // x
0., // y
h2->GetBinError(i, j) ); // z
#endif /* 0 or 1 */
}
delete h2; // no longer needed
#if 1 /* 0 or 1 */
Double_t zmin = 1.; // e.g. -1. or 0. or 1.
for (int i = (g->GetN() - 1); i >= 0; i--)
if (g->GetZ()[i] <= zmin) g->RemovePoint(i); // remove if "z" <= "zmin"
#endif /* 0 or 1 */
//Fit g with original function f2
Float_t ratio = 4*nentries/100000;
f2params[ 0] *= ratio;
f2params[ 5] *= ratio;
f2params[10] *= ratio;
f2->SetParameters(f2params);
g->Fit("f2","N");
f2->SetNpx(80);
f2->SetNpy(80);
f2->SetMaximum(800);
f2->SetLineColorAlpha(kBlack, 0.1);
f2->SetTitle("some Thing;some X;some Y;some Z");
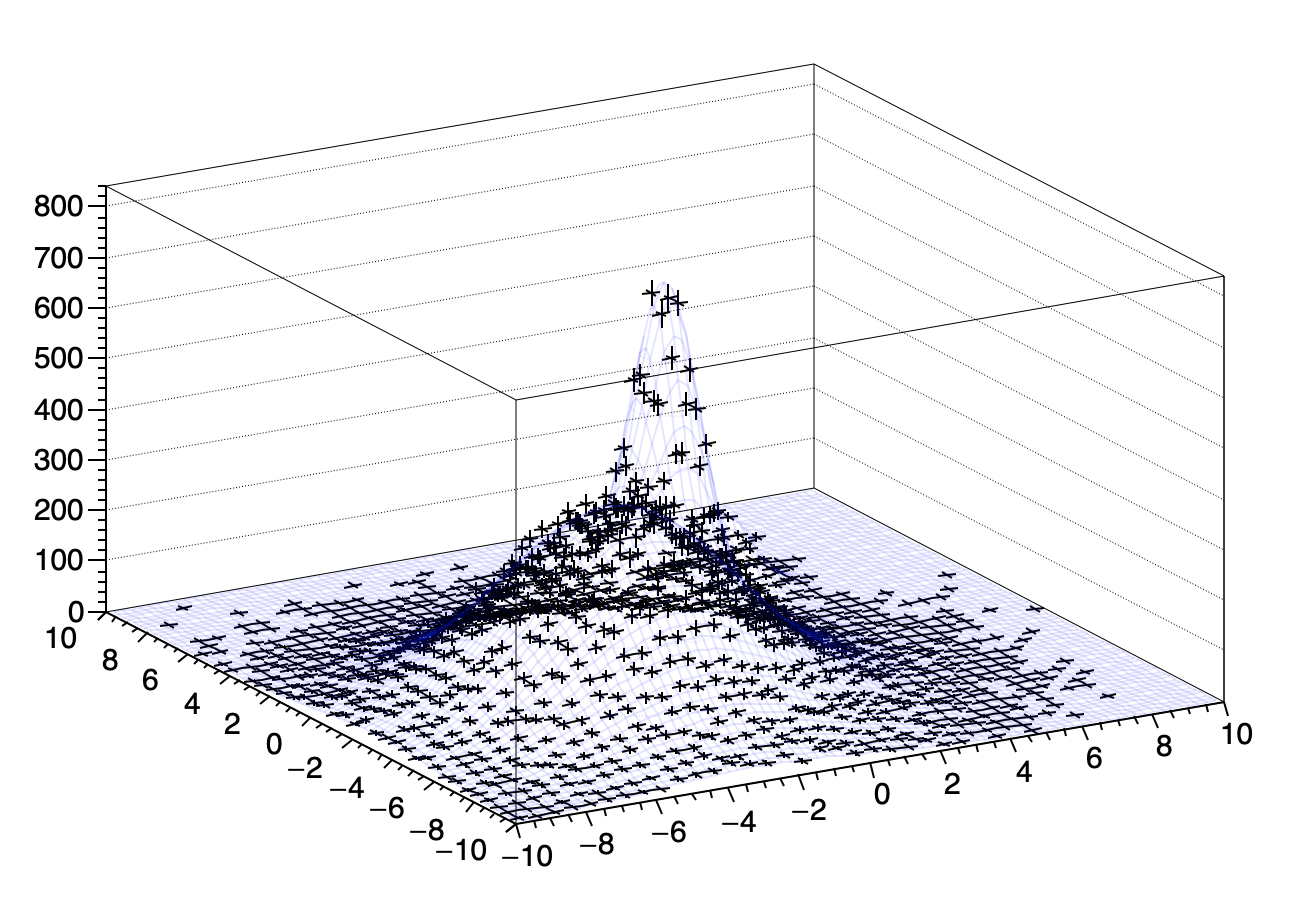
#if 1 /* 0 or 1 */
gStyle->SetPalette(55, 0, 0.1); // 55 = kRainBow
f2->Draw("surf2 fb"); // must be drawn first (due to a bug in ROOT)
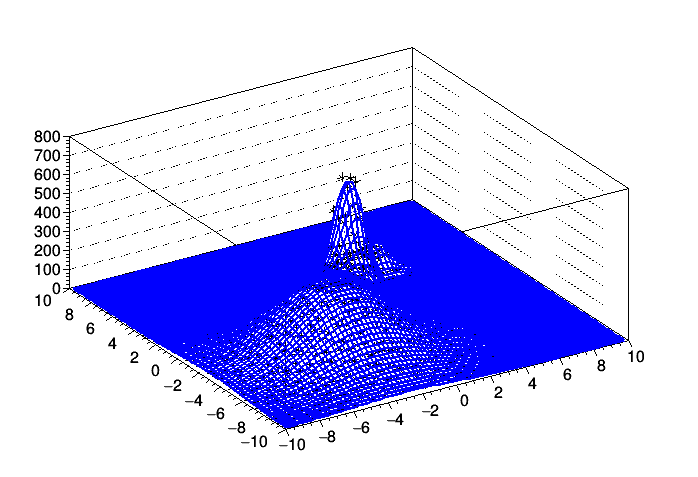
#else /* 0 or 1 */
f2->Draw("surf fb"); // must be drawn first (due to a bug in ROOT)
#endif /* 0 or 1 */
// g->SetMaximum(800);
g->SetMarkerStyle(kCircle); g->SetMarkerSize(0.5); // "p", "p0", "pcol"
g->SetMarkerColorAlpha(kBlack, 0.5); // "p", "p0"
g->SetLineColorAlpha(kBlack, 0.5); // "err"
g->Draw("err p fb same"); // "p" or "p0" or "pcol"
}