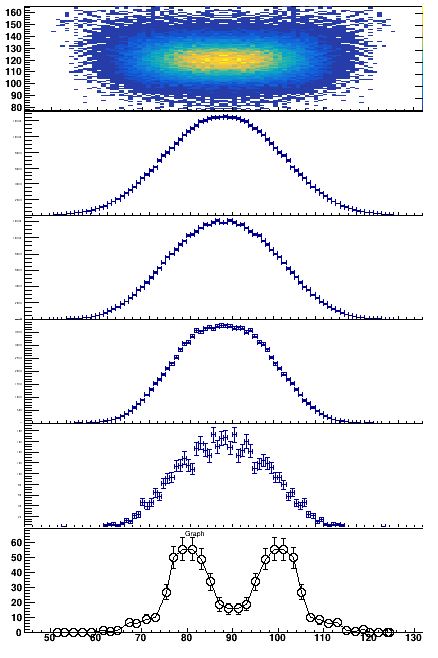
I cannot run your example because I do not have your data. But it works form me with your vertical stacking:
/// \file
/// \ingroup tutorial_graphics
/// \notebook
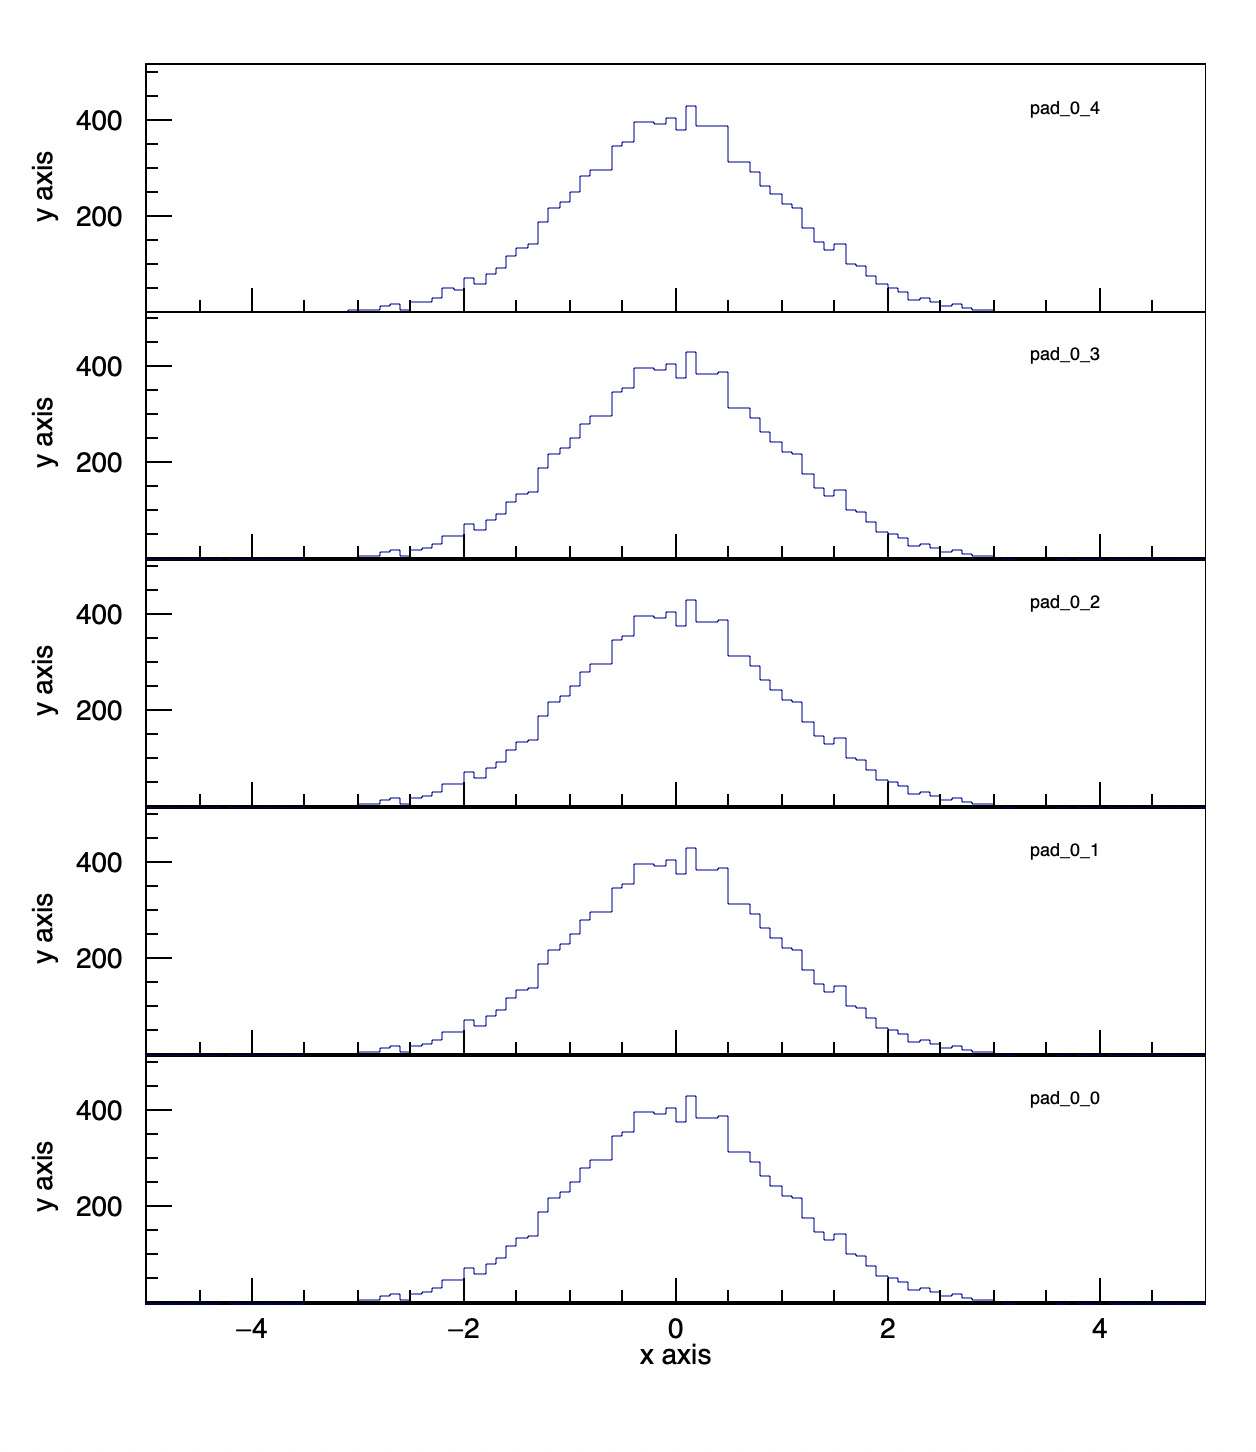
/// Example of canvas partitioning.
/// Sometimes the Divide() method is not appropriate to divide a Canvas.
/// Because of the left and right margins, all the pads do not have the
/// same width and height. CanvasPartition does that properly. This
/// example also ensure that the axis labels and titles have the same
/// sizes and that the tick marks length is uniform.
/// In addition, XtoPad and YtoPad allow to place graphics objects like
/// text in the right place in each sub-pads.
///
/// \macro_image
/// \macro_code
///
/// \author Olivier Couet
void CanvasPartition(TCanvas *C,const Int_t Nx = 2,const Int_t Ny = 2,
Float_t lMargin = 0.15, Float_t rMargin = 0.05,
Float_t bMargin = 0.15, Float_t tMargin = 0.05);
double XtoPad(double x);
double YtoPad(double x);
void canvas2()
{
gStyle->SetOptStat(0);
auto C = (TCanvas*) gROOT->FindObject("C");
if (C) delete C;
C = new TCanvas("C","canvas",640,800);
C->SetFillStyle(4000);
// Number of PADS
const Int_t Nx = 1;
const Int_t Ny = 5;
// Margins
Float_t lMargin = 0.12;
Float_t rMargin = 0.05;
Float_t bMargin = 0.15;
Float_t tMargin = 0.05;
// Canvas setup
CanvasPartition(C,Nx,Ny,lMargin,rMargin,bMargin,tMargin);
// Dummy histogram.
auto h = (TH1F*) gROOT->FindObject("histo");
if (h) delete h;
h = new TH1F("histo","",100,-5.0,5.0);
h->FillRandom("gaus",10000);
h->GetXaxis()->SetTitle("x axis");
h->GetYaxis()->SetTitle("y axis");
TPad *pad[Nx][Ny];
for (Int_t i = 0; i < Nx; i++) {
for (Int_t j = 0; j < Ny; j++) {
C->cd(0);
// Get the pads previously created.
pad[i][j] = (TPad*) C->FindObject(TString::Format("pad_%d_%d",i,j).Data());
pad[i][j]->Draw();
pad[i][j]->SetFillStyle(4000);
pad[i][j]->SetFrameFillStyle(4000);
pad[i][j]->cd();
// Size factors
Float_t xFactor = pad[0][0]->GetAbsWNDC()/pad[i][j]->GetAbsWNDC();
Float_t yFactor = pad[0][0]->GetAbsHNDC()/pad[i][j]->GetAbsHNDC();
TH1F *hFrame = (TH1F*) h->Clone(TString::Format("h_%d_%d",i,j).Data());
// y axis range
hFrame->SetMinimum(0.0001); // do not show 0
hFrame->SetMaximum(1.2*h->GetMaximum());
// Format for y axis
hFrame->GetYaxis()->SetLabelFont(43);
hFrame->GetYaxis()->SetLabelSize(16);
hFrame->GetYaxis()->SetLabelOffset(0.02);
hFrame->GetYaxis()->SetTitleFont(43);
hFrame->GetYaxis()->SetTitleSize(16);
hFrame->GetYaxis()->SetTitleOffset(2);
hFrame->GetYaxis()->CenterTitle();
hFrame->GetYaxis()->SetNdivisions(505);
// TICKS Y Axis
hFrame->GetYaxis()->SetTickLength(xFactor*0.04/yFactor);
// Format for x axis
hFrame->GetXaxis()->SetLabelFont(43);
hFrame->GetXaxis()->SetLabelSize(16);
hFrame->GetXaxis()->SetLabelOffset(0.02);
hFrame->GetXaxis()->SetTitleFont(43);
hFrame->GetXaxis()->SetTitleSize(16);
hFrame->GetXaxis()->SetTitleOffset(1);
hFrame->GetXaxis()->CenterTitle();
hFrame->GetXaxis()->SetNdivisions(505);
// TICKS X Axis
hFrame->GetXaxis()->SetTickLength(yFactor*0.06/xFactor);
// Draw cloned histogram with individual settings
hFrame->Draw();
TText text;
text.SetTextAlign(31);
text.SetTextFont(43);
text.SetTextSize(10);
text.DrawTextNDC(XtoPad(0.9), YtoPad(0.8), gPad->GetName());
}
}
C->cd();
}
void CanvasPartition(TCanvas *C,const Int_t Nx,const Int_t Ny,
Float_t lMargin, Float_t rMargin,
Float_t bMargin, Float_t tMargin)
{
if (!C) return;
// Setup Pad layout:
Float_t vSpacing = 0.0;
Float_t vStep = (1.- bMargin - tMargin - (Ny-1) * vSpacing) / Ny;
Float_t hSpacing = 0.0;
Float_t hStep = (1.- lMargin - rMargin - (Nx-1) * hSpacing) / Nx;
Float_t vposd,vposu,vmard,vmaru,vfactor;
Float_t hposl,hposr,hmarl,hmarr,hfactor;
for (Int_t i=0;i<Nx;i++) {
if (i==0) {
hposl = 0.0;
hposr = lMargin + hStep;
hfactor = hposr-hposl;
hmarl = lMargin / hfactor;
hmarr = 0.0;
} else if (i == Nx-1) {
hposl = hposr + hSpacing;
hposr = hposl + hStep + rMargin;
hfactor = hposr-hposl;
hmarl = 0.0;
hmarr = rMargin / (hposr-hposl);
} else {
hposl = hposr + hSpacing;
hposr = hposl + hStep;
hfactor = hposr-hposl;
hmarl = 0.0;
hmarr = 0.0;
}
for (Int_t j=0;j<Ny;j++) {
if (j==0) {
vposd = 0.0;
vposu = bMargin + vStep;
vfactor = vposu-vposd;
vmard = bMargin / vfactor;
vmaru = 0.0;
} else if (j == Ny-1) {
vposd = vposu + vSpacing;
vposu = vposd + vStep + tMargin;
vfactor = vposu-vposd;
vmard = 0.0;
vmaru = tMargin / (vposu-vposd);
} else {
vposd = vposu + vSpacing;
vposu = vposd + vStep;
vfactor = vposu-vposd;
vmard = 0.0;
vmaru = 0.0;
}
C->cd(0);
auto name = TString::Format("pad_%d_%d",i,j);
auto pad = (TPad*) C->FindObject(name.Data());
if (pad) delete pad;
pad = new TPad(name.Data(),"",hposl,vposd,hposr,vposu);
pad->SetLeftMargin(hmarl);
pad->SetRightMargin(hmarr);
pad->SetBottomMargin(vmard);
pad->SetTopMargin(vmaru);
pad->SetFrameBorderMode(0);
pad->SetBorderMode(0);
pad->SetBorderSize(0);
pad->Draw();
}
}
}
double XtoPad(double x)
{
double xl,yl,xu,yu;
gPad->GetPadPar(xl,yl,xu,yu);
double pw = xu-xl;
double lm = gPad->GetLeftMargin();
double rm = gPad->GetRightMargin();
double fw = pw-pw*lm-pw*rm;
return (x*fw+pw*lm)/pw;
}
double YtoPad(double y)
{
double xl,yl,xu,yu;
gPad->GetPadPar(xl,yl,xu,yu);
double ph = yu-yl;
double tm = gPad->GetTopMargin();
double bm = gPad->GetBottomMargin();
double fh = ph-ph*bm-ph*tm;
return (y*fh+bm*ph)/ph;
}