Hi @Wile_E_Coyote@couet
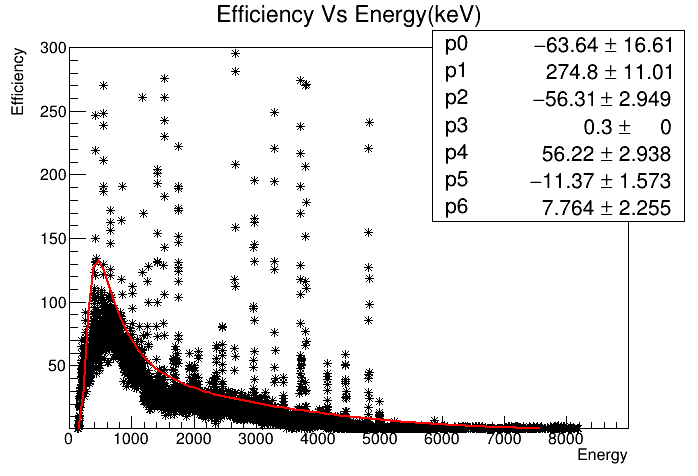
A plot is made by me and i am fitting this plot by a user defined function.
Below are the files that I’m working on: eu_gu_1.txt (44.1 KB) rough.C (1.1 KB)
@Wile_E_Coyote@couet@moneta
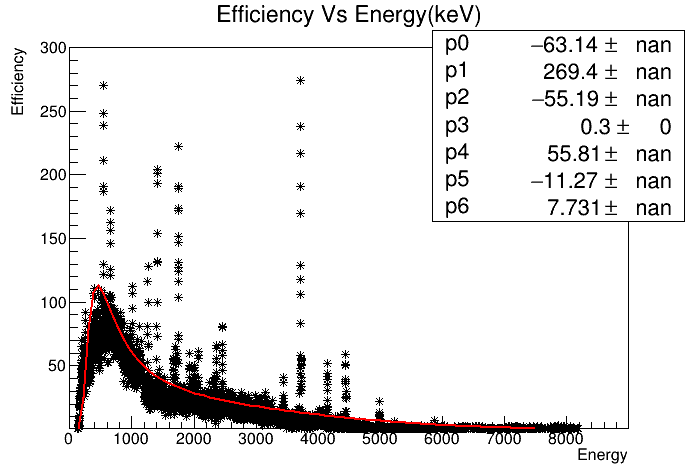
The problem seems to arise as soon as i change the parameters even so slightly.
nan is shown in the parameter error.
The parameters that i got are the best that i could get so far.
Please see how and why this nan appears in parameters error even after changing the parameters slightly.
Help me!!!
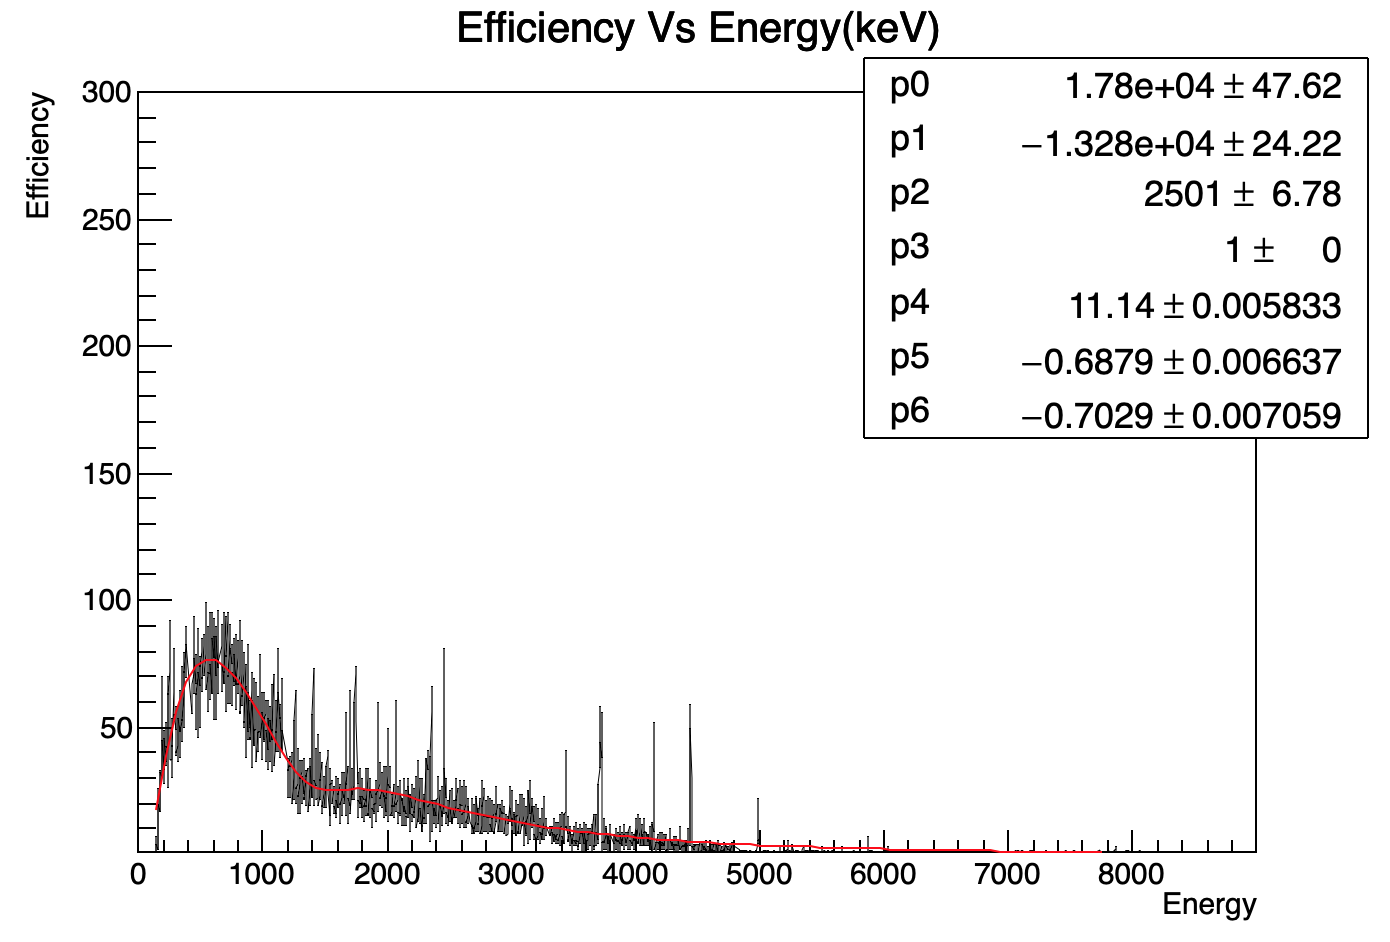
Your fit function tries to describe the “background” only.
But all “data points” contribute to the chi^2.
If you “remove” peaks, you will get lower chi^2.
Thanks @Wile_E_Coyote.
Can we do anything about fixing parameters?
because each parameter is showing large error as you can see above.
Also, if i am changing the values slightly error becomes nan.
@couet@Wile_E_Coyote
I see a decrease in the value of chi square and there comes the next question which is how can this nan be removed? because when i slightly change the parameter it shows nan.