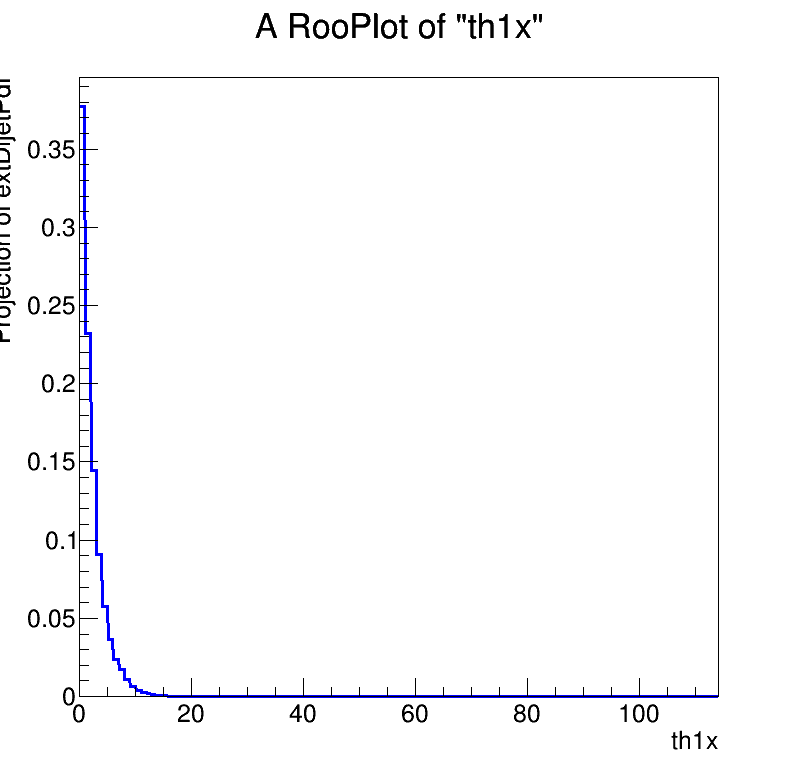
I am having an issue when creating a TF1 from a RooAddPdf from a workspace. The code is attached below as “pdfToTh1.py”. mypdf properly loads the pdf titled “ExtDijetPdf” from the saved workspace; I can plot this using RooFit and I see the function I expect, this is the attachment “rfcanv.png” which shows a decreasing power function in blue.
Then, I try to convert this to a histogram using createHistogram . The key line is:
sbkg = mypdf.createHistogram("h_binned_diphoton_power", w.var('mjj'), RooFit.Binning(3100,0.,3100.)) #Create histogram from pdf
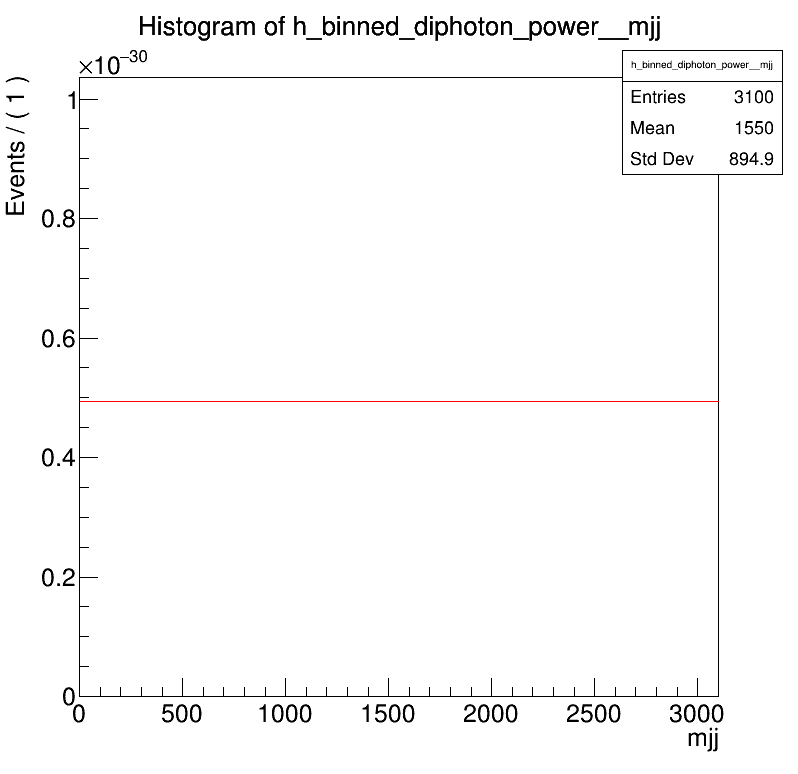
I then plot this on a plain TCanvas and the output is a constant line at 0.5x10^-30; this is attached as “tfCanv.png”. What is going wrong with this conversion?
My ultimate goal is to take my Pdf and convert it to a TFunction that I can plot. I do not have to use the createHistogram function so if this is not the best way please suggest an alternative. Otherwise, please help me to understand what I may be doing wrong. Unfortunately, the code relies on a self defined compiled function so it cannot be run just as-is. Please let me know if there is more info I can provide to make this more understandable.
Thanks in advance for any help. pdfToTh1.py (612 Bytes)
it looks to me like the observable you create the histogram for is actually not the observable of the PDF.
The PDF observable seems to be th1x, as I can see on the labels of your “good” plot. However, in createHistogram, you are using mjj. As the PDF doesn’t depend on this other observable, it is indeed flat. Have you tried using th1x there?
It’s also true that createHistogram is not necessarily the best way to the a TF1 to plot your pdf. What I would recommend instead depends on the type of the PDF, however. You say it’s a RooAddPdf, but what type are it’s components? Is it a purely binned pdf, or does it also involve continuous functions?
For continuous pdfs, I would use RooAbsReal::asTF(). But if you have a binned PDF, then it’s indeed best to convert it to a histogram. Still, the binning will be figured out automatically, so the Binning argument you pass to createHistogram is not really necessary.
Your PDF looks like it’s binned, so createHistogram is the right way I think. Just make sure to use consistent observables.
You were right about the variable name, switching to th1x made this work.
The components are indeed a binned pdf which is why I was using createHistogram. I have made a workaround to crudely plot my function as a TH1 which works for the time being, although I would still like to get to a TF1 eventually. I do have access to the raw fit parameters, so I may end up needing just to manually write the fitted function