Hello there,
I’m trying to draw a TGraphError but i can’t understand why i can’t get error bars to show.
Here’s my code:
void errplot(TString channel = "pk", TString bdtCut = "0.0", TString configuration = "3.3.3.-3"){
using namespace std;
using namespace RooFit;
using namespace TMath;
TString pidEffs_dir = "/home/path";
TString pidEffs_name = pidEffs_dir + "/pidEffs_"+ bdtCut+ "_"+configuration+".root";
TFile *pidEffs_file = new TFile(pidEffs_name, "READ");
int pid1 = ((TObjString *) configuration.Tokenize(".")->At(0))->String().Atoi();
int pid2 = ((TObjString *) configuration.Tokenize(".")->At(1))->String().Atoi();
int pid3 = ((TObjString *) configuration.Tokenize(".")->At(2))->String().Atoi();
int pid4 = ((TObjString *) configuration.Tokenize(".")->At(3))->String().Atoi();
float bdt = bdtCut.Atof();
TCanvas * c = new TCanvas("c", "c", 2200, 1800);
c->Divide(2,2);
c->cd(1);
gPad->SetLeftMargin(0.15);
///////////////////////////////1
auto g1 = new TGraphErrors();
int pointCounter1 = 0;
for(int pid1var:{1,3,5,7,9,11,13}){
if(channel == "pk" ||(channel == "ppi" && pid4 <= pid1var)){
TString currentConfiguration = Form("%s_%d.%d.%d.%d", bdtCut.Data(), pid1var, pid2, pid3, pid4);
double sum=0;
double sumErr=0;
double sumOfSquares=0;
TString toyResFile=Form("/home/path2.root");
TFile * file = new TFile(toyResFile, "READ");
int counter1 = 0;
int currentPoint = 1;
double mean = 1;
double errErr = 0;
for(int i = 0;i<10;i++){
TString nome_result = Form("result_0%d", i);
auto result = (RooFitResult*)file->Get(nome_result);
auto l = result->floatParsFinal();
auto var = (RooRealVar*)l.at(2);
double err = var->getError();
auto edmRes = result->edm();
auto covQualRes = result->covQual();
if (covQualRes == 3 && edmRes < 0.001){
sum+=err;
sumOfSquares+=(err*err);
counter1++;
}
}
if(counter1>0){
mean = sum/counter1;
}
for(int i = 0;i<10;i++){
TString nome_result = Form("result_0%d", i);
auto result = (RooFitResult*)file->Get(nome_result);
auto l = result->floatParsFinal();
auto var = (RooRealVar*)l.at(2);
double err = var->getError();
auto edmRes = result->edm();
auto covQualRes = result->covQual();
if (covQualRes == 3 && edmRes < 0.001){
sumErr+=((err-mean)*(err-mean));
}
}
if(counter1>0){
double RMSerr = Sqrt(sumErr/counter1);
cout << pid1var << " " << counter1<< " " << mean << " +- " << RMSerr <<"\n";
g1->SetPoint(currentPoint,pid1var,mean);
g1->SetPointError(currentPoint, 0, RMSerr);
currentPoint++;
}
file->Close();
}
}
//TGraphErrors *g1 = new TGraphErrors(pointCounter1, &x1[0], &y1[0], nullptr, &yerr1[0]);
g1->SetLineWidth(0);
g1->SetMarkerStyle(20);
g1->SetMarkerSize(2);
if(channel == "pk"){ g1->SetTitle(";#Delta log L_{p-#pi}(p); #sigma(A_{raw}(pK))");}
else if(channel == "ppi"){ g1->SetTitle(";#Delta log L_{p-#pi}(p); #sigma(A_{raw}(p#pi))");}
g1->GetYaxis()->SetMaxDigits(2);
g1->GetYaxis()->SetLabelSize(0.04);
g1->GetXaxis()->SetLabelSize(0.04);
g1->GetXaxis()->SetTitleSize(0.04);
g1->GetYaxis()->SetTitleSize(0.04);
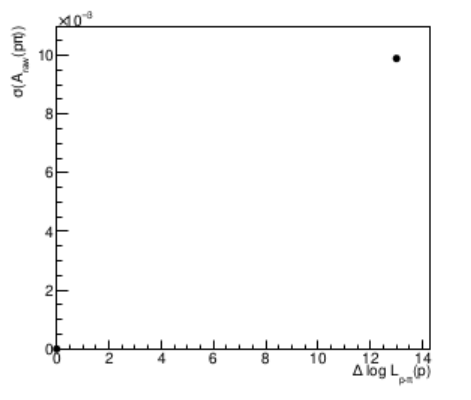
g1->Draw();
If i change
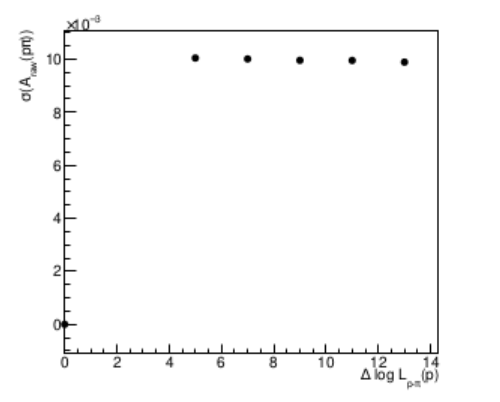
g1->SetPoint(currentPoint,pid1var,mean);
g1->SetPointError(currentPoint, 0, RMSerr);
with
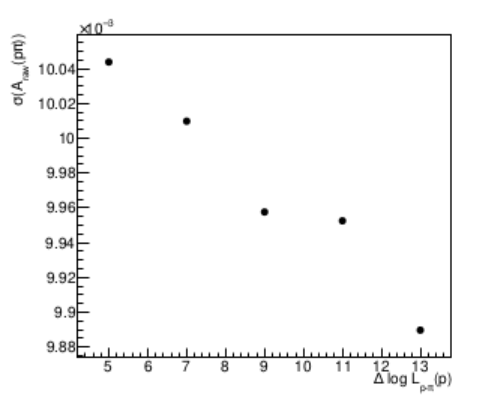
g1->AddPoint(pid1var,mean);
I get the expected result (without the error bars that i need)
or with
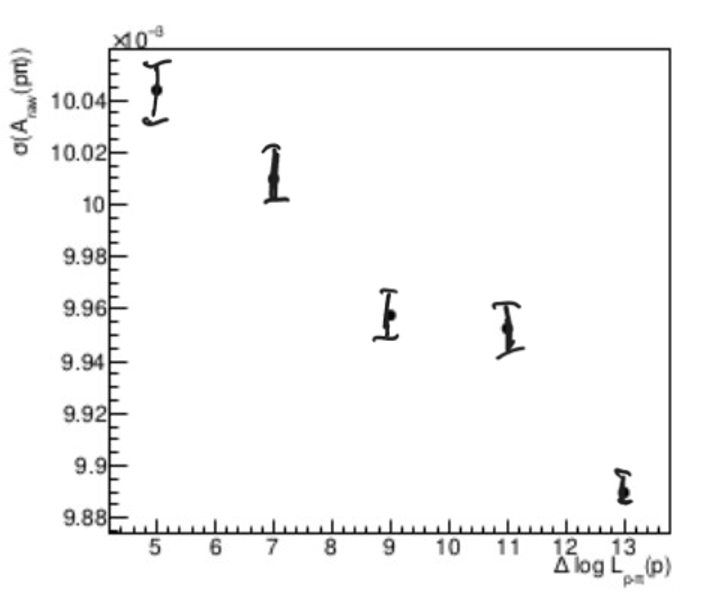
g1->SetPoint(g1->GetN(),pid1var,mean);
g1->SetPointError(g1->GetN()-1, 0, RMSerr);
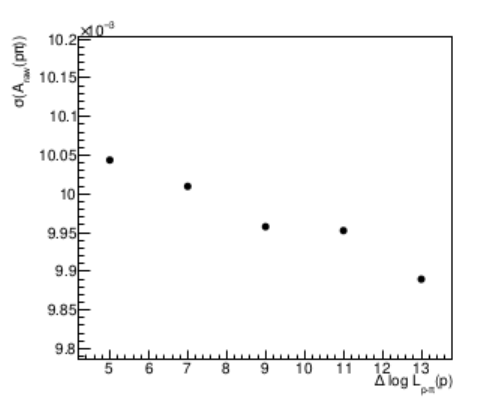
which seems to have left space for the error bars (should be around 1% and 0.5% of the value) //5: 0.0100437 ± 0.000124156
Sidenote: A TgraphError method to add points with error should be very much needed
g1->AddPoint(x,y,ex,ey);
if it already exists i wasn’t able to find it