Hello everyone,
I am doing my bachelor thesis using GATE and ROOT. I am simulating a scintillation crystal with a 25x25 Matrix of APD (each 2 mm wide) at the end. A 511 keV gamma enters the crystal, scintillates and gives luminescence photons or optical photons that will be read out with the APD. To analyse these optical photons, i have two C++ Scripts that read out the .root file. One of them (named in the attachments Diagrams.cpp) gives the optical photons distribution in 2-D and 3-D Diagrams on the APD and additional information like x,y,z position of the gamma interaction in crystal. The second script (named Data.cpp in the attachments) gives the optical photons distribution as numbers in a .dat file. It contains a m x 628 where m is the number of scintillation events and 628 refers to the 25x25 APD plus first three columns are again the x,y,z of the gamma interaction in crystal.
The Problem is that for example at a z Position of 16 mm from the APD, the diagrams show a wide distribution and a very big FWHM which is logic, but at the same position the Data (after being reshaped to 25x25 matrix with Matlab) show a better and a finer distribution with a small FWHM. I want to know what is the problem in the Data.cpp and why does it give me such good distributions.
I would be thankful for your help.
In the attachments you can find both scripts, sorry i can’t upload a .root file to test because it has a very big size. Diagrams.cpp (7.31 KB) Data.cpp (5.75 KB)
Both macros you posted need the file Probe1.root. It is difficult to see what is wrong without it.
If it is too big may be you can put it on some server ready for download ?
I meant: if, as you said, the root file is too big for this forum, put it in some other place so we can download it (something like DropBox would be fine). Or, if possible, make a smaller version of it (it has to reproduce the problem though).
Ok, I ran your macros… Diagrams.cpp gives me 156 png files and Data.cpp gives several thousand lines of numbers with no comments. Can you tell be a bit more precisely what I should look at ?
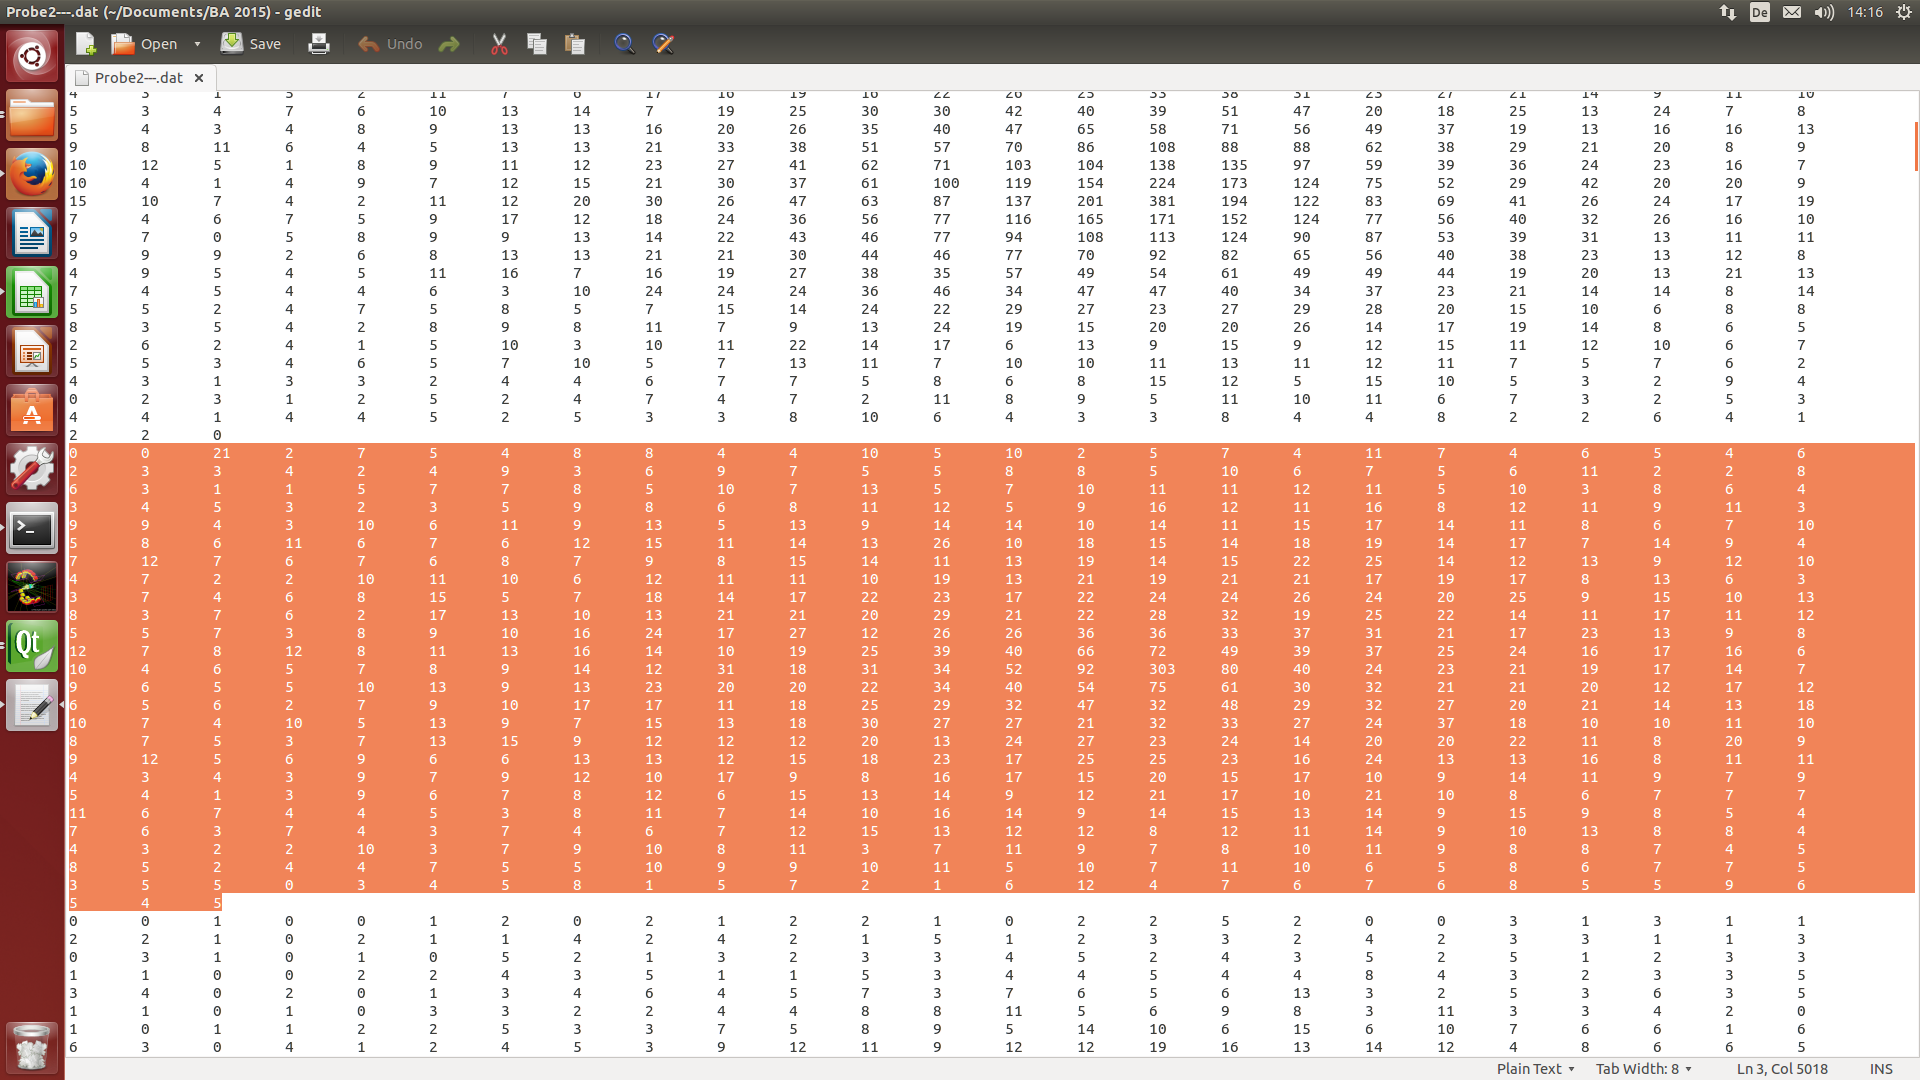
if you are running linux (Ubuntu), the .dat file shows many blocks, each block represents a scintillation event, and each block has 628 elements, the first 3 numbers (in the picture, i marked a block with first three letters 0 0 21) are the x y and z position of the interaction in crystal.
the other 625 are the optical photons distribution on the 25x25 APD Matrix.
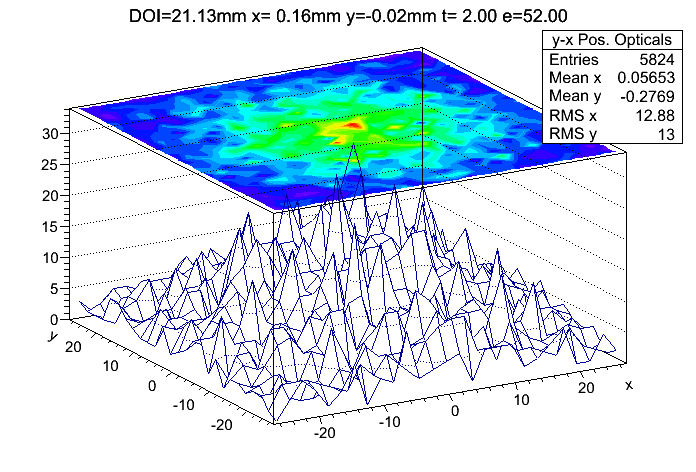
I chose this block of x=0 y=0 and z=21 to compare the photons distribution with another Diagram that has also z=21 (or DOI=21). We can see a big difference between the given diagram, and a plotted Diagram from the chosen Data.
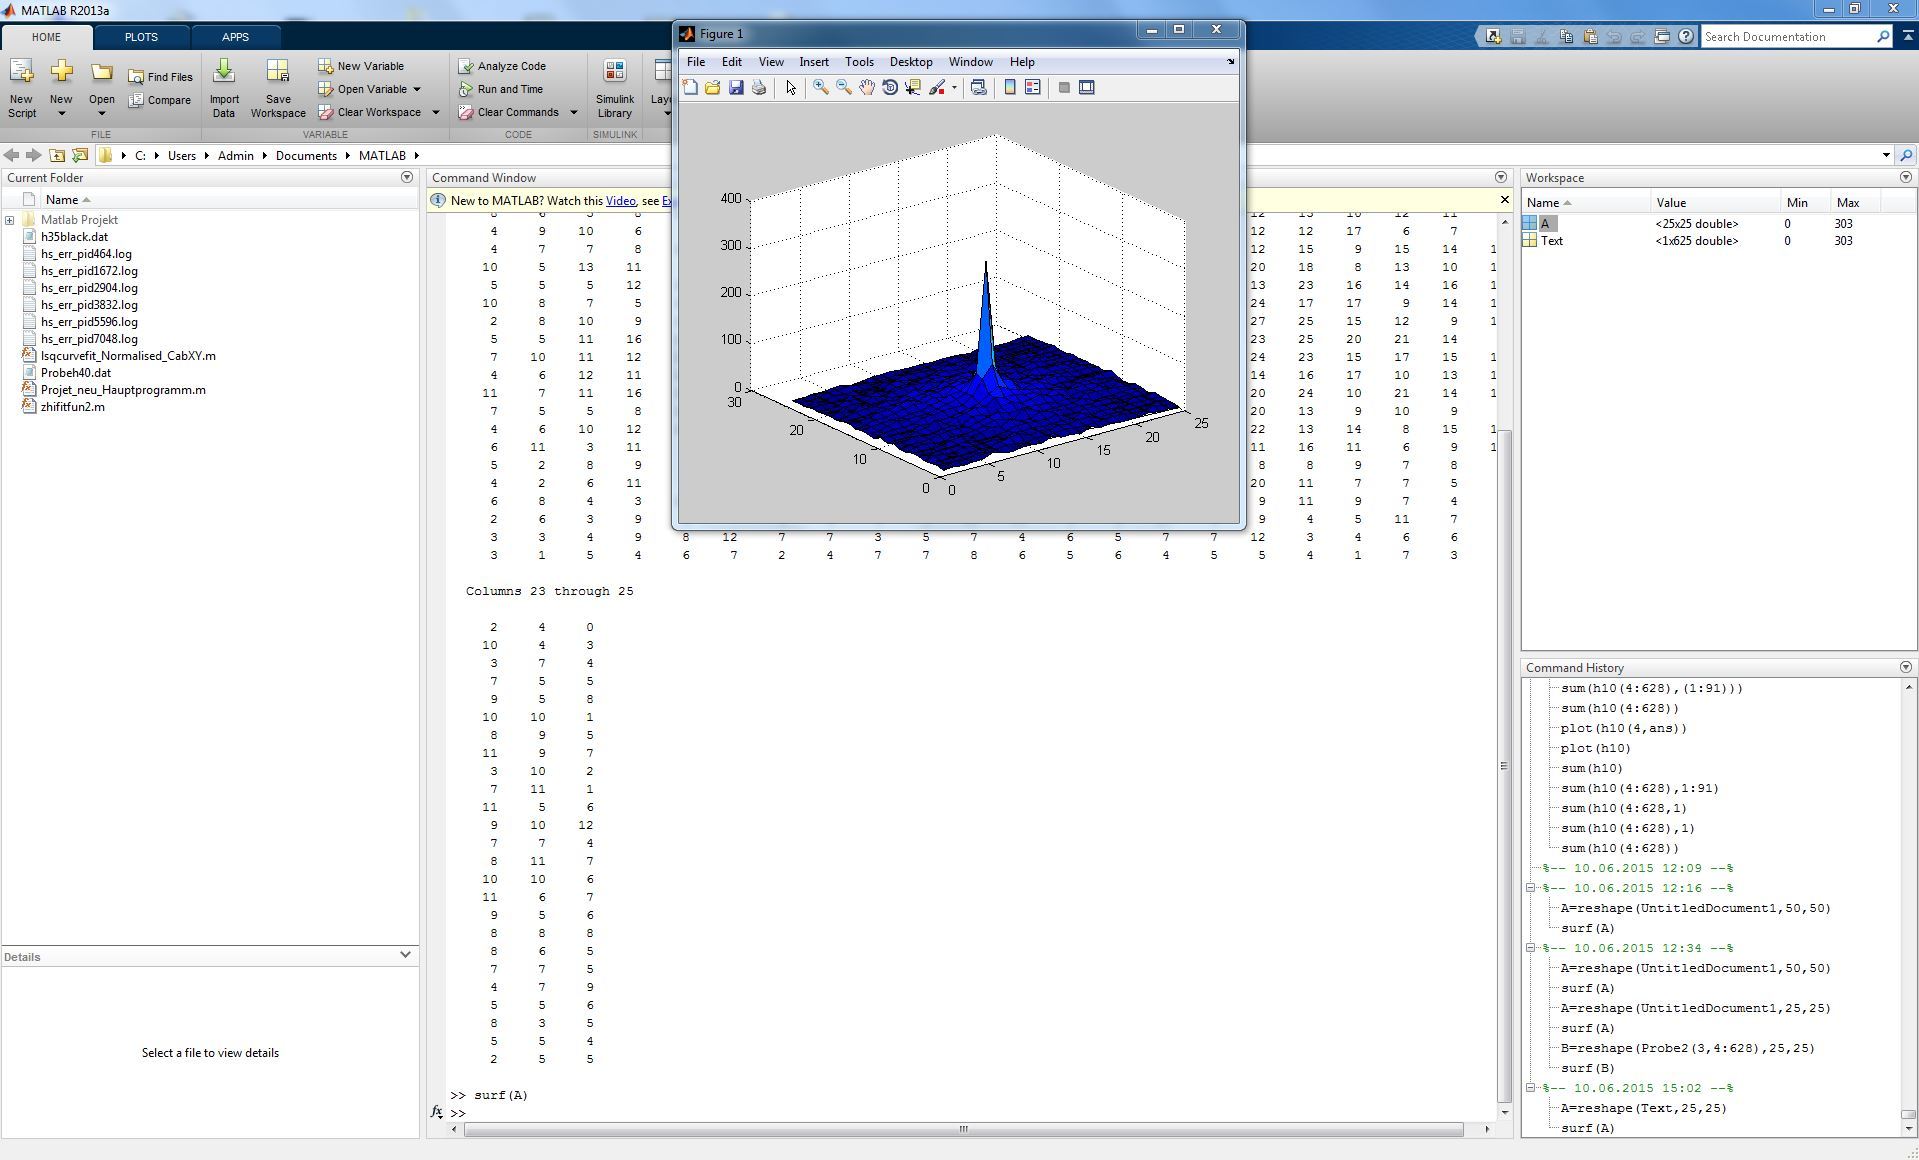
yes exactly, and now with this file you can choose a block for example the one i marked in this picture, and copy it into a text file ‘‘Text’’, then open it with Matlab, and reshape the matrix, for example in Maltab you write: M=reshape(Text(4:628,1),25,25) or M=reshape(Text(1,4:628),25,25) … it depends how your matlab reads the .txt file.
I did it with Matlab, and you can see the result in my diagram, this is not logic because with a distance of 21 mm to the APD we don’t get such a good peak. You can compare now this diagram with the other one with same z=21.13 mm given by Diagram.cpp
I think logically the opposite is correct, the one we get from ROOT diagrams are logic, the ones we get from ROOT dat are not logic, so i want to make sure if the Data.cpp script is correct, or how we can correct it
just looking at the 2 plots I can already see that you are not comparing the same things: Your Mathlab X an Y axis have the limits [0,25] and [0,30], whereas the ROOT ones are [-20, 20]…
yes this is one thing, i don’t know if it changes the results, but the one with ROOT Diagrams copies the photons distribution from root file directly, and because each Photo diode is 2 mm wide, so it takes from -25 to +25 which is 50 mm. In .dat file it gives the distribution on each Photo diode, that means not in function of the distance. I tried to change the Data.cpp so that it gives me from -25 to +25 but it didn’t work. If we can achieve it maybe this will be the solution
I have one more question please, is there a way in ROOT to track the optical photons? I want that the luminescence happens in a spherical way, that means that the angle between each optical photon the same is. Is there anyway to know how the vectors of the photons are?