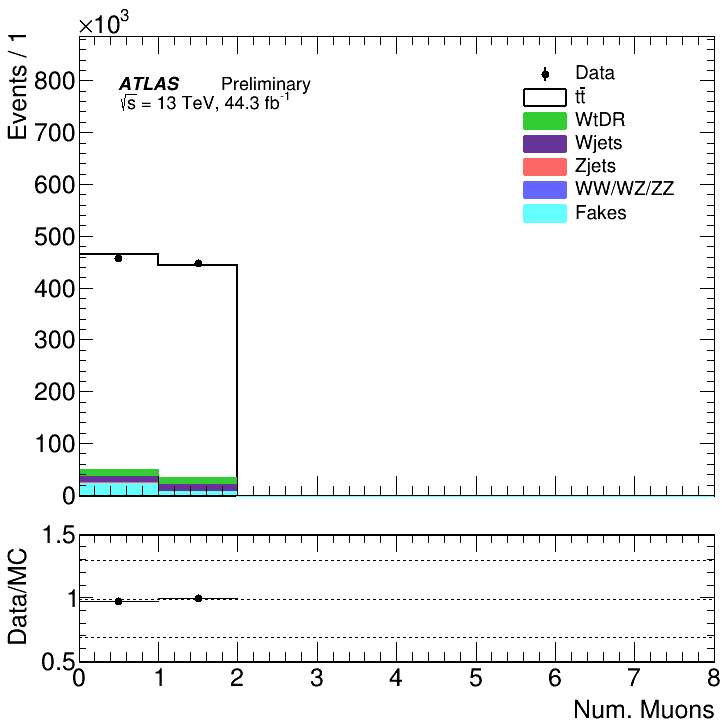
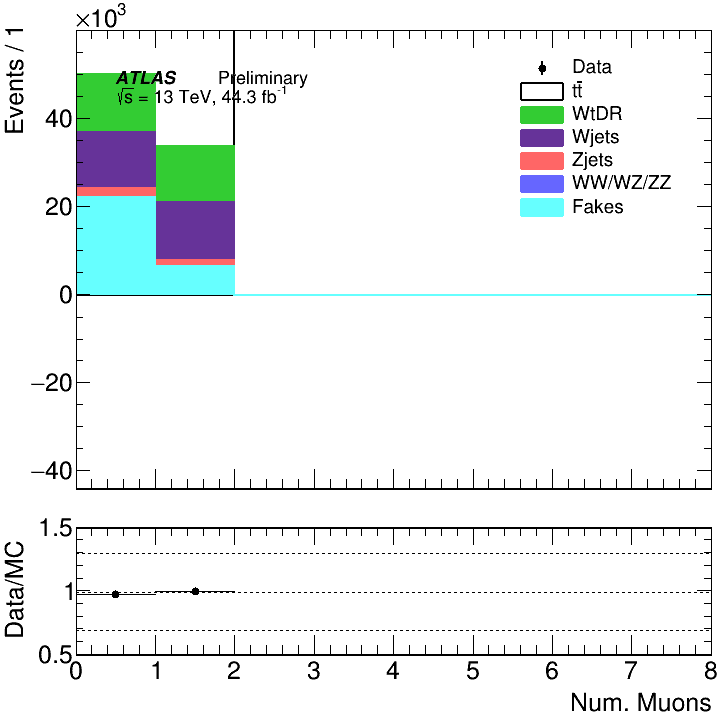
Whenever I try plotting a TRatioPlot using a THStack and a regular TH1, the x-axis of the bins with zero entries takes the fill color of the ‘bottom’ histogram in the stack.
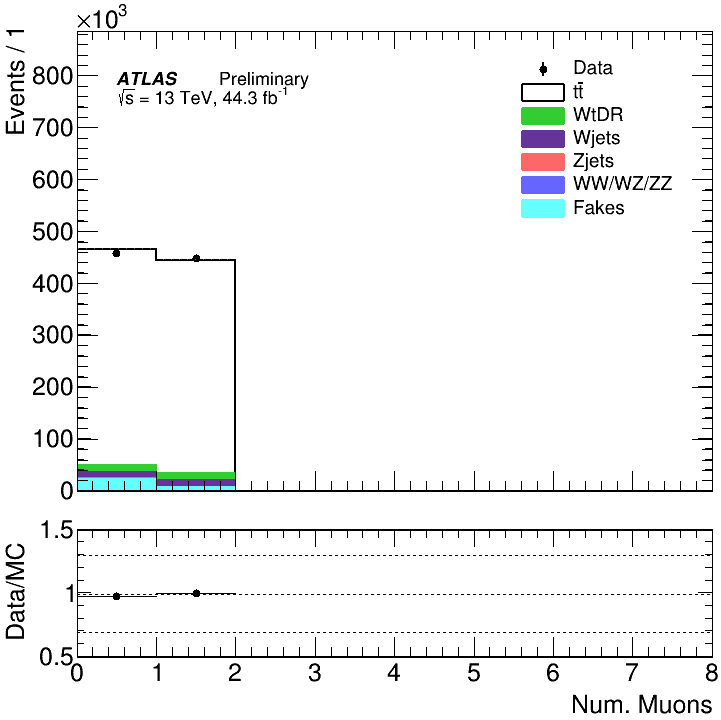
In the above examples, for the zero bins >= 2, the x-axis takes on the color of the first histogram in the stack. How can I prevent this and just keep the x-axis a black color and prevent this color from spilling out? Setting each of the histogram line colors to black seems to resolve this issue, but is there anyway to do this without having to do this?
Here is some representative pseudo-code for how I am filling these histograms
TH1F* dataHist = (TH1F*)file->Get(dataHistName.c_str());

THStack* hStack = new THStack("", "");
for(int i = 0; i < numHists; i++){
    TH1F* iHist = (TH1F*)file->Get(histName[i].c_str());
    iHist->SetFillColor(colors[i]);
    iHist->SetLineColor(colors[i]);
    hStack->Add(iHist);
}

auto ratioPlot = new TRatioPlot(hStack, dataHist);
ratioPlot->Draw();
_ROOT Version: 6.24/06 Platform: Not Provided Compiler: Not Provided
Yes, that would have been my recommendation. But I was interested to see in which condition we see this effect, as I was not able to reproduce it with a simple example…
Thanks for your suggestion, I tried this but this results in the appearance of ‘doubled’ tick marks on the y-axis, almost as if the new redrawn axis is not being drawn exactly on top of the existing axis.
Similarly, trying with the standalone code posted earlier, I see the same pattern of double y-axis tick marks, which becomes especially apparent once I zoom in.
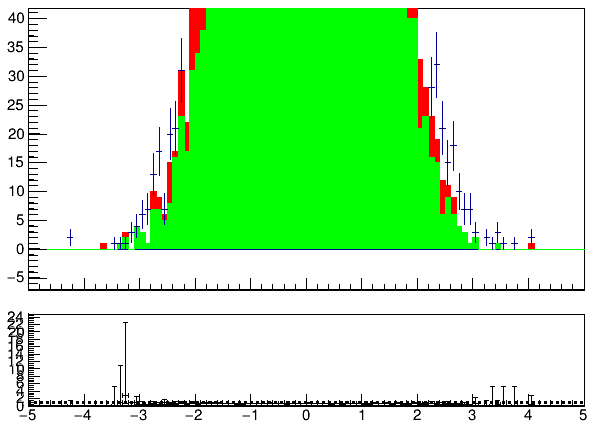
{
    TCanvas *c = new TCanvas();

    TH1F *h1 = new TH1F("h1","Histo 1",100,-5,5);
    h1->FillRandom("gaus",10000);
    TH1F *h2 = new TH1F("h2","Histo 2",100,-5,5);
    h2->FillRandom("gaus",5000);
   TH1F *h3 = new TH1F("h3","Histo 3",100,-5,5);
    h3->FillRandom("gaus",2000);

    h1->SetFillColor(4);
    h2->SetFillColor(3);
    h2->SetLineColor(3);
    h3->SetFillColor(2);
    h3->SetLineColor(2);

    THStack *hs = new THStack("hs","A stack of histograms");

    hs->Add(h2);
    hs->Add(h3);

    TRatioPlot *ratioPlot = new TRatioPlot(hs, h1);
    ratioPlot->Draw();

    ratioPlot->GetUpperPad()->RedrawAxis();
 }