Hey Rooters,
I ran into a wierd issue when attempting to plot a TGraph2D with one of the coordinates being negative and planar.
For example
TGraph2D* graph()
{
  TGraph2D* graph = new TGraph2D(1000);
  for(int iP = 0; iP < 1000;iP ++)
  {
    graph->SetPoint(iP,rand()%10/10.0,-5,rand()%10/10.0);
  }
  return graph;
}
Leads to an unsightly dump when trying to draw (see below). It looks like the range is being bumped in magnitude not value. Ie it’s trying to make ymin > ymax.
Thoughts?
root [1] b = graph()
(TGraph2D *) 0x7fc3facc35b0
root [2] b->Draw()
Info in <TCanvas::MakeDefCanvas>:  created default TCanvas with name c1
Error in <TCanvas::Range>: illegal world coordinates range: x1=-0.112500, y1=-4.937500, x2=1.012500, y2=-5.062500
Error in <TCanvas::RangeAxis>: illegal axis coordinates range: xmin=0.000000, ymin=-4.950000, xmax=0.900000, ymax=-5.050000
Error in <TView3D::ResetView>: Error in min-max scope
Error in <TView3D::ResetView>: Error in min-max scope
Error in <TView3D::ResetView>: Error in min-max scope
Error in <TView3D::SetRange>: problem setting view
Error in <TView3D::ResetView>: Error in min-max scope
Thanks for the prompt reply. I recognize it is because the data are planar. In the case where the axis is positive the range is automatically taken as a small delta around the plane and a reasonable view is generated.
For example with
TGraph2D* graph()
{
  TGraph2D* graph = new TGraph2D(1000);
  for(int iP = 0; iP < 1000;iP ++)
  {
    graph->SetPoint(iP,rand()%10/10.0,5,rand()%10/10.0);
  }
  return graph;
}
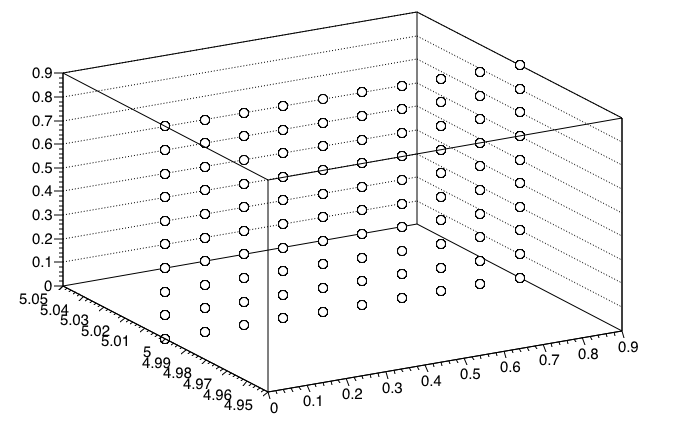
the range is set to ymin = 4.95 ymax = 5.05
and the resultant call to draw is meaningful
ie it produces
But with the negative case, the automatic change to the range is in magnitude from zero, not in absolute value.
ie ymin = -4.95 ymax = -5.05 and the axis range is invalid. I’m guessing this isn’t the desired behavior, as I would hope it would behave the same regardless of whether the plane was positive or negative?
I can obviously fudge it to get a reasonable plot.