I have modified a bit your macro to make it more clear.
{
   TFile f("Fig_9_0.root");
   auto C = new TCanvas("C","C",600,800);
   C->Divide(1,2);

   C->cd(1);
   nt->Draw("abs(tw1-tw2)");
   nt->Draw("abs(tw1-tw2)>>h(100, 0, 1)", "", "same");
   printf("Number of bins in h = %d\n", h->GetNbinsX());
   printf("h xmin = %g\n", h->GetXaxis()->GetXmin());
   printf("h xmax = %g\n", h->GetXaxis()->GetXmax());
   h->SetLineColor(2);
   gPad->SetLogy(1);

   C->cd(2);
   nt->Draw("abs(tw1-tw2)>>h2(100, 0, 1)");
   printf("\nNumber of bins in h2 = %d\n", h2->GetNbinsX());
   printf("h2 xmin = %g\n", h2->GetXaxis()->GetXmin());
   printf("h2 xmax = %g\n", h2->GetXaxis()->GetXmax());
   h->SetLineColor(2);
   h->Draw("same");
   h2->SetLineColor(4);
   gPad->SetLogy(1);
}
it gives the output:
Number of bins in h = 100
h xmin = 0
h xmax = 1.1

Number of bins in h2 = 100
h2 xmin = 0
h2 xmax = 1
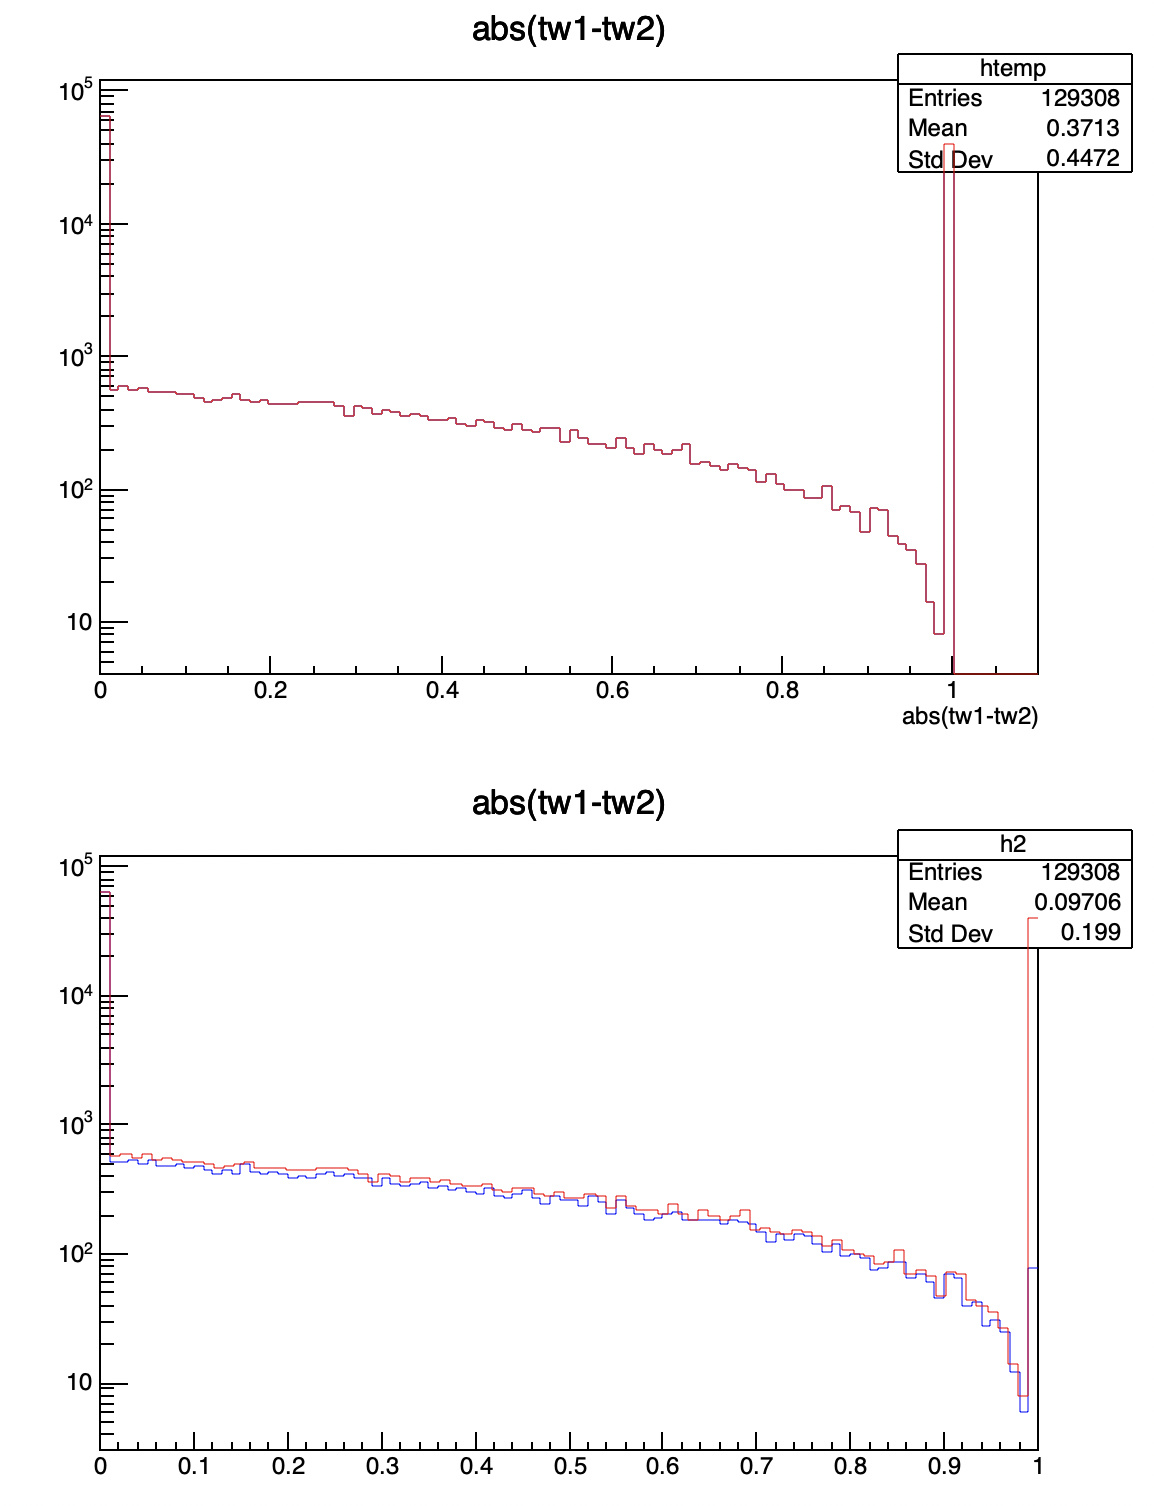
and the picture:
So it is clear that h and h2 have different upper limits and that option “same” for h forces the upper limit to be equal to the upper limit of the plot already on the canvas. I would suggest you do but the following way:
{
   TFile f("Fig_9_0.root");
   auto C = new TCanvas("C","C",600,800);
   C->Divide(1,2);

   C->cd(1);
   auto h = new TH1D("h","h",100, 0, 1);
   nt->Draw("abs(tw1-tw2)");
   nt->Draw("abs(tw1-tw2)>>h", "", "same");
   printf("Number of bins in h = %d\n", h->GetNbinsX());
   printf("h xmin = %g\n", h->GetXaxis()->GetXmin());
   printf("h xmax = %g\n", h->GetXaxis()->GetXmax());
   h->SetLineColor(2);
   gPad->SetLogy(1);

   C->cd(2);
   auto h2 = new TH1D("h2","h2",100, 0, 1);
   nt->Draw("abs(tw1-tw2)>>h2");
   printf("\nNumber of bins in h2 = %d\n", h2->GetNbinsX());
   printf("h2 xmin = %g\n", h2->GetXaxis()->GetXmin());
   printf("h2 xmax = %g\n", h2->GetXaxis()->GetXmax());
   h->SetLineColor(2);
   h->Draw("same");
   h2->SetLineColor(4);
   gPad->SetLogy(1);
}
The output is:
Number of bins in h = 100
h xmin = 0
h xmax = 1

Number of bins in h2 = 100
h2 xmin = 0
h2 xmax = 1