Hi,
Does ROOT support 2D polar plots of histograms? I’m trying to draw contour lines on it, what I (think I) can’t achieve with the POL & SURF or LEGO options.
Any idea?
Cheers,
Colas
Hi,
Does ROOT support 2D polar plots of histograms? I’m trying to draw contour lines on it, what I (think I) can’t achieve with the POL & SURF or LEGO options.
Any idea?
Cheers,
Colas
Use TGraphPolar. see:
root.cern.ch/root/html/TGraphPolar.html
I may not have been clear, I’m trying to plot an histogram, not a graph.
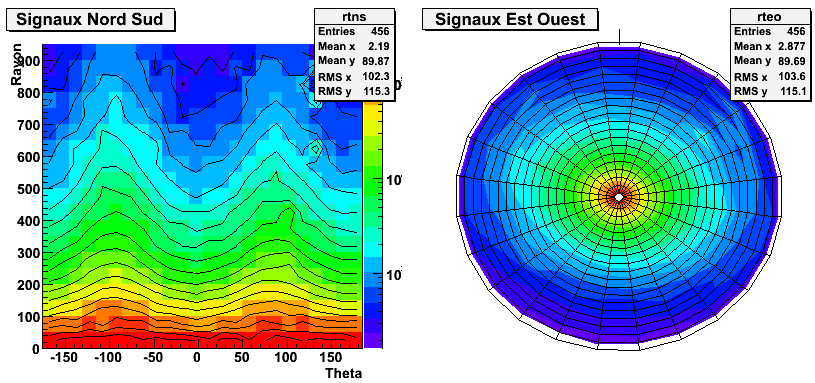
In the picture attached, on the left is a 2D cartesian plot with 20 contours lines, and on the right side is a top view of a 3D plot with POL & CONT3 options.
I need to have a 2D polar plot with the contour lines. Is it feasible?
Thanks,
Colas
Ah ok. Use the SURF option (instead of SURF1) and you will get contour lines.
the POL option is valid only with LEGO and SURF. Not with CONT.