I’ve finally managed to install ROOT 7 on my own Mac, making the use of the lab PC in the university obsolete. However I encountered a problem at the switch to ROOT 7 from a previous version on the other PC: I’m missing the ‘Point number display’ in the event status bar in a TBrowser.
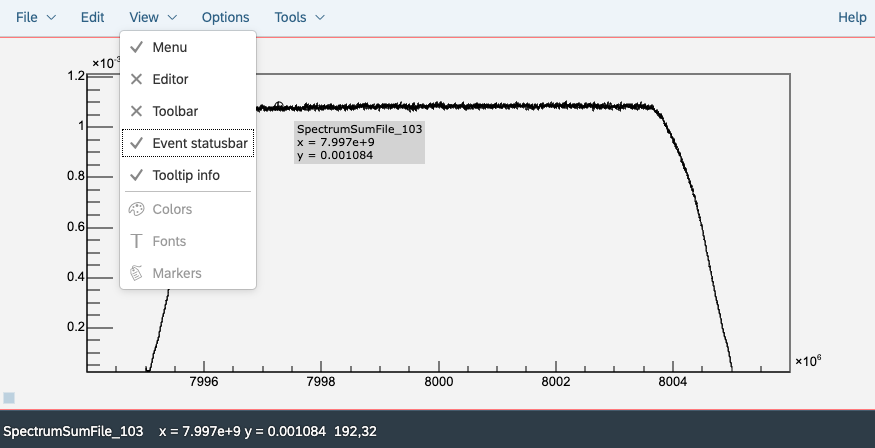
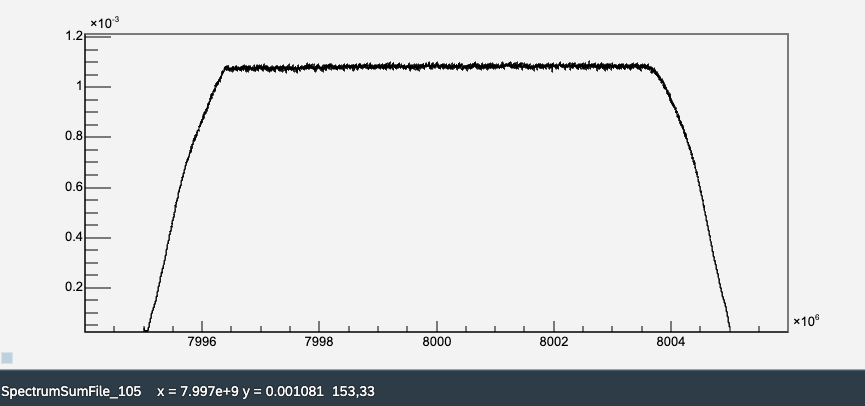
In the picture below I’m only interested in the (relatively) stable plateau in the middle, hence I want to cut away the rise and fall on either ends of the Spectrum. For this I need the Point number which is (judging by eye) the first and last point to still be part of the plateau. In the previous version I was able to see that here the plateau is between points 450 and 2600, however in ROOT 7 I can’t find an option to display that. On the older version it displayed (x,y) of the mouse, (x,y) of the data and the point number in the data. Now there is just (x,y) of the data and a yet unidentified (non-integer) number, which goes up to 640.3 and obviously can’t be the searched for Point number since 1) it’s non-integer and 2) the data has ca. 3100 points and the number only goes up to 640.
Where can I activate the Point number display in ROOT 7 on my Mac?
ROOT Version: 7
Platform: Mac