Hi there!
I have a root file (“data.root”) with two TH1D files on it:
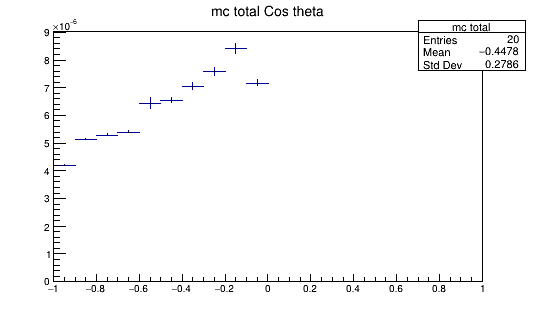
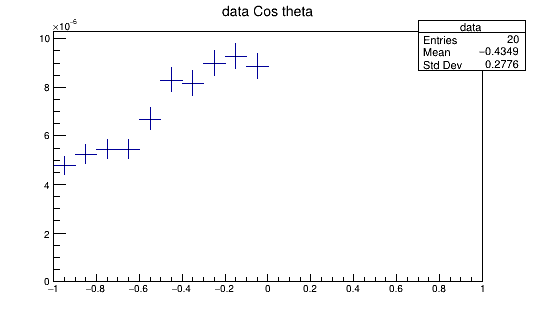
“ICRC_V2_hists/Cos theta/data” and "“ICRC_V2_hists/Cos theta/MC”
I have made this script to plot the two histograms together:
import ROOT
import numpy as np
import uproot
import matplotlib.pyplot as plt
f = uproot.open(“data.root”)
fig, ax = plt.subplots()
h_data = f[“ICRC_V2_hists/Cos theta/data”].to_numpy()
h_MC = f[“ICRC_V2_hists/Cos theta/MC”].to_numpy()
hists = [h_MC, h_data]
for h in hists :
** ax.hist(h[1][:-1],**
** bins = h[1],**
** weights = h[0],**
** histtype = ‘step’,**
** zorder=10)**
ax.set_xlabel(‘cos(\theta’)
ax.set_ylabel(‘Rate [Hz]’)
ax.grid(zorder=0)
plt.tight_layout()
plt.show()
But the result is something like:
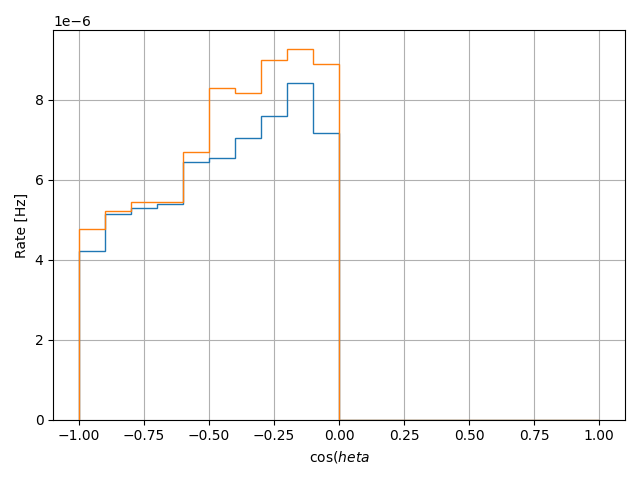
What I want to do is to give this step format for “MC” but to keep the original dataformat for “data” (I meen, not a bar hist but points with errorbars, as seen above).
How can I do it?
Thanks in advance!