Hello, I’m a ROOT newbie (and computing newbie in general). I don’t know the proper terminology to explain what I want to do, but it’s the following:
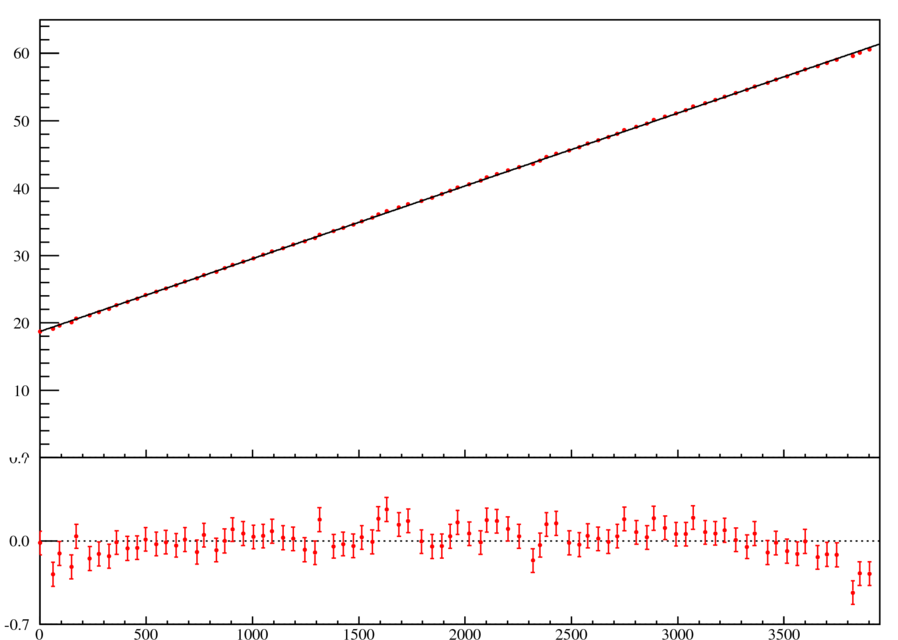
Let’s say I have a plot of a fitted graph with error bars. I want to make a plot under the main graph of the difference between the points of the graph and their respective points of the function. This other plot must also have the same error bars as the main graph.
I already know how to plot the main fitted graph. The following image is an example of what I want to do, made in ROOT.
TRatioPlot seems to be what I wanted, but the tutorials only use histograms, not graphs with error bars. So, I used ratioplot2.C as a mold to try and make one with TGraphErrors. However, it didn’t work. I’m very new to C++ as well (I started learning it along with ROOT), so there might be a few mistakes.
Here’s the code:
{
   gStyle->SetOptStat(0);
   auto c1 = new TCanvas("c1", "fit residual simple");
   auto h1 = new TGraphErrors("graph.txt");
   h1->SetMarkerStyle(20);
   auto fit = new TF1("fit", "pow(x,[p0]) + [p1]",0,61);
   h1->Fit("fit","R");
   h1->GetXaxis()->SetTitle("x");
   c1->Clear();
   auto rp1 = new TRatioPlot(h1);
   rp1->Draw();
   rp1->GetLowerRefYaxis()->SetTitle("ratio");
   rp1->GetUpperRefYaxis()->SetTitle("entries");
   c1->Update();
}
I’ve tried running it, but it gave me the following error:
/home/marcos/root/test/./ratioplot.cxx:11:19: error: no matching constructor for initialization of 'TRatioPlot'
   auto rp1 = new TRatioPlot(h1);
                  ^          ~~
/home/marcos/root/etc/../include/TRatioPlot.h:48:4: note: candidate constructor not viable: no known conversion from 'TGraphErrors *' to 'const TRatioPlot' for 1st argument
   TRatioPlot(const TRatioPlot &hrp) = delete;
   ^
/home/marcos/root/etc/../include/TRatioPlot.h:165:4: note: candidate constructor not viable: no known conversion from 'TGraphErrors *' to 'TH1 *' for 1st argument
   TRatioPlot(TH1* h1, Option_t *option = "", TFitResult *fitres = 0);
   ^
/home/marcos/root/etc/../include/TRatioPlot.h:159:4: note: candidate constructor not viable: requires 0 arguments, but 1 was provided
   TRatioPlot();
   ^
/home/marcos/root/etc/../include/TRatioPlot.h:161:4: note: candidate constructor not viable: requires at least 2 arguments, but 1 was provided
   TRatioPlot(TH1* h1, TH1* h2, Option_t *option = "pois");
   ^
/home/marcos/root/etc/../include/TRatioPlot.h:163:4: note: candidate constructor not viable: requires at least 2 arguments, but 1 was provided
   TRatioPlot(THStack* st, TH1* h2, Option_t *option = "pois");
A good starting point could be the “${ROOTSYS}/tutorials/hist/ratioplotOld.C” tutorial (it does not use the TRatioPlot class). You will just need to replace the two histograms there with your graph and your function.
A first very simple attempt to convert a graph to a th1 before making the ratio plot. is not really convincing:
void graphratio()
{
   gStyle->SetOptStat(0);
   auto c1 = new TCanvas("c1", "fit residual simple");
   auto g1 = new TGraphErrors("graph.txt");
   g1->SetMarkerStyle(20);
   auto fit = new TF1("fit", "pow(x,[p0]) + [p1]",0,61);
//   g1->Fit("fit","R");

   g1->GetXaxis()->SetTitle("x");

   auto nPoints = g1->GetN();

   auto h1 = new TH1D("h1","h1",100,g1->GetPointX(0),g1->GetPointX(nPoints-1));
   double x,y;
   for(int i=0; i < nPoints; ++i) {
      g1->GetPoint(i, x, y);
      h1->Fill(x,y);
   }

   h1->Fit("fit","R");

   auto rp1 = new TRatioPlot(h1);
   rp1->Draw();
   rp1->GetLowerRefYaxis()->SetTitle("ratio");
   rp1->GetUpperRefYaxis()->SetTitle("entries");
}